Ensemble Oceanic NINO Index (ENS ONI)
**UPDATED: MAR 4, 2024**
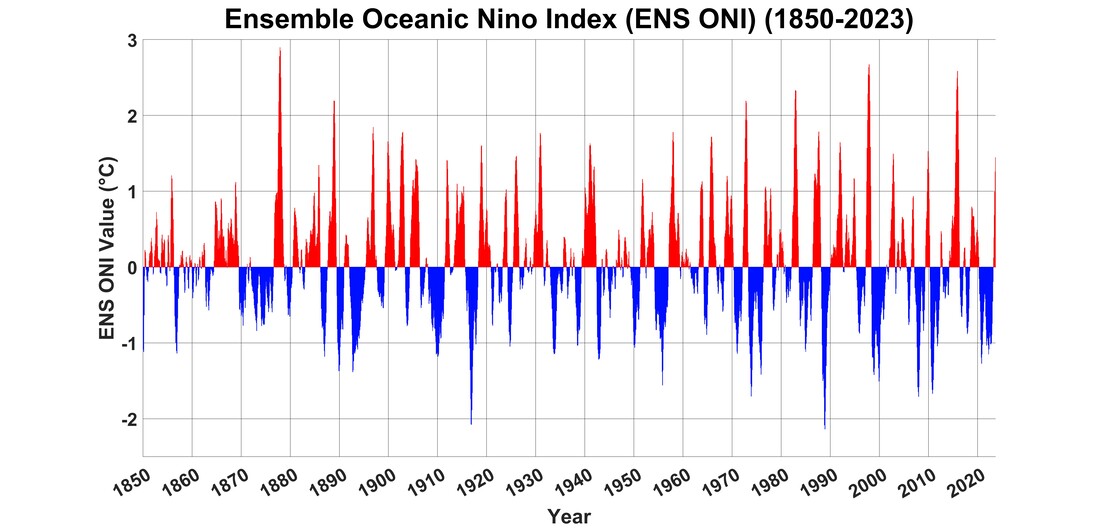
Figure 1. ENS ONI time series (1850 - Nov 2023)
Created using Matlab 2022b
Created using Matlab 2022b
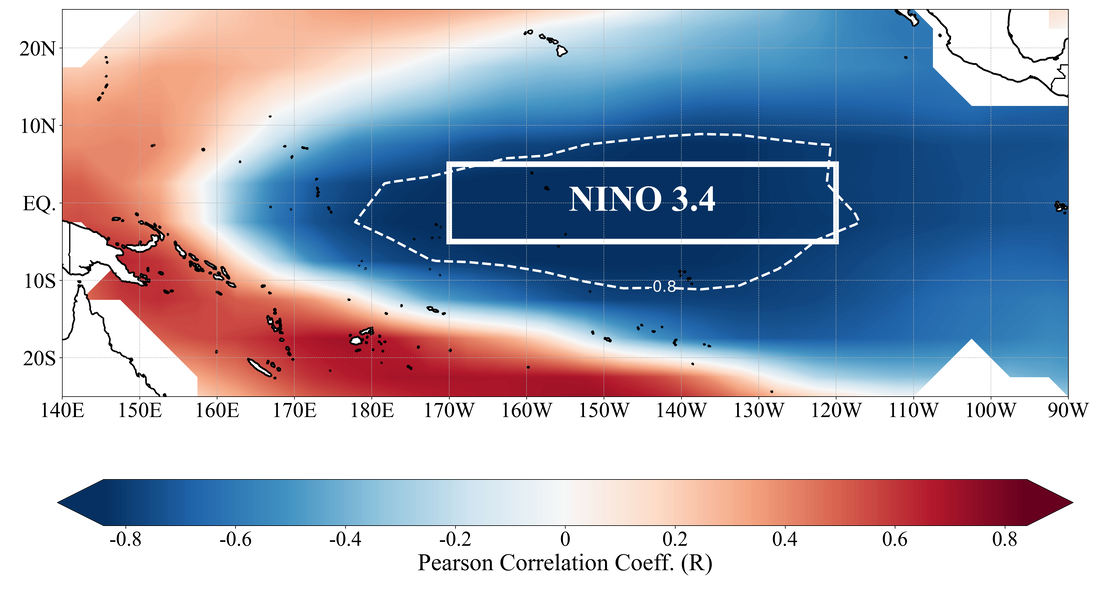
Figure 2. Pearson correlation coefficient (R-value) between the Southern Oscillation Index (SOI) and SST anomalies (1891-2010), from a mean of COBE SST2, HADISST2, ERSSTv5, ERSSTv4, Kaplan Extended SSTv2, HADISST, & COBE SST (all datasets bi-linearly interpolated to 5x5° grid spacing using nctoolkit python package), adapted from figure 1 in Webb & Magi (2021) & is intended to be analogous to figure 2 in Barnston (1997). The NINO 3.4 region (5°N - 5°S, 170°W - 120°W) is demarcated by a solid white box. An R-value of -0.8 is denoted by the dotted white line.
Note: The land-sea mask in Kaplan Extended SSTv2 causes discontinuities (white space) near the edges of the figure.
Created in Python v3.9
Note: The land-sea mask in Kaplan Extended SSTv2 causes discontinuities (white space) near the edges of the figure.
Created in Python v3.9
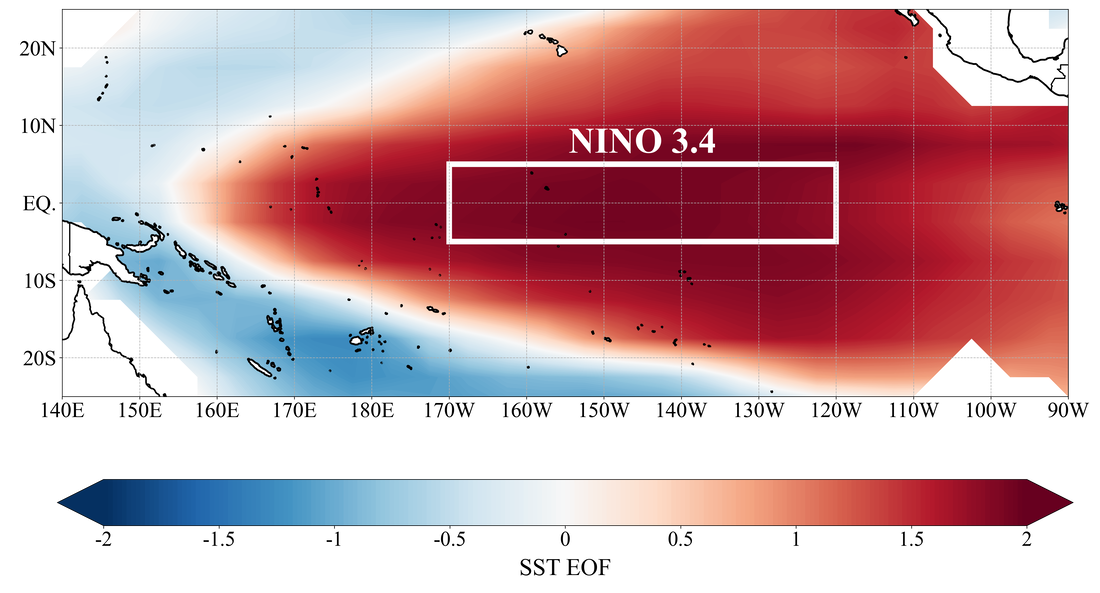
Figure 3. Leading mode (1st EOF (unitless)) of Tropical Pacific (25°N - 25°S, 140°E - 90°W) SST anomalies (1891-2010), from a mean of COBE SST2, HADISST2, ERSSTv5, ERSSTv4, Kaplan Extended SSTv2, HADISST, & COBE SST (all datasets bi-linearly interpolated to 5x5° grid spacing using nctoolkit python package), adapted from figure 1 in Webb & Magi (2021) & is intended to be analogous to figure 3 in Barnston (1997).
The NINO 3.4 region (5°N - 5°S, 170°W - 120°W) is demarcated by a solid white box.
Note: The land-sea mask in Kaplan Extended SSTv2 causes discontinuities (white space) near the edges of the figure.
Created in Python v3.9
The NINO 3.4 region (5°N - 5°S, 170°W - 120°W) is demarcated by a solid white box.
Note: The land-sea mask in Kaplan Extended SSTv2 causes discontinuities (white space) near the edges of the figure.
Created in Python v3.9
MAJOR UPDATES TO THE ENSEMBLE OCEANIC NINO INDEX (ENS ONI)
November 2023: Due to the dropout of a few long-term SST datasets (e.g. Kaplan Extended SSTv2), several high-resolution SST datasets were added and converted a 1x1° degree grid to improve the near real-time estimates. These datasets include: The Operational Sea Surface Temperature & Sea Ice Analysis (OSTIA), Coral Reef Watch (CRW) SST, ODYSSEA SST, European Space Agency SST Climate Change Initiative (ESA SST CCI)
July 2022: MERRA-2 reanalysis was extended from 2016 to the present
April 2022: Raw monthly ENS ONI input from all 32 SST + reanalysis datasets have been released
February 2022: ENS ONI published in the International Journal of Climatology
(Accepted PDF): The Ensemble Oceanic Nino Index (Webb & Magi, 2022)
May 2021: ENS ONI median definitions are now presented in percent instead of raw numeric values to allow for more intuitive interpretations of the data.
April 2021: ENS ONI median definitions (described below) were added to the suite of available output.
March 2021: ENS ONI data for 1850-1864 has now been released, several datasets were added, and the juxtaposition of ENS ONI's 30-year sliding base periods were updated to be more symmetric with the 5-year periods (Dr Brian Magi, person comm). The pre-1865 extension of the ENS ONI reveals a potential El Nino event in 1855-56, which is strongly supported by recent work from Lin et al (2020) depicting this particular El Nino to be associated with the 2nd worst drought during the Qing dynasty in China. Applying a 30-year sliding median to Madras SLP (1796-2003) reconstructed by Allan et al (2002) also reveals substantial evidence of an El Nino in 1855-56 w/ 30-year median SLP anomalies exceeding +1.2σ in November 1855, which is near the top 10% of all Novembers in 1796-2003.
Experiments with pre-1850 instrumentally-based data like the aforementioned Madras SLP and available reanalysis over this period (like NOAA 20CRv3 (Slivinski et al (2019)) and corroboration with documentary sources such as
Garcia-Herrera et al (2008), Ortileb (2000), & Quinn et al (1987) reveal fairly substantial evidence of an El Nino in the winter of 1845-46.
Simple Ocean Data Assimilation version 2.2.4 (SODAv2.2.4) (1871-2010) (Giese and Ray (2011)), ECMWF's Ocean Reanalysis System 5 (ORAS5) (Zuo et al (2019)) (which is used for the operational ECMWF model), & NASA's Modern-Era Retrospective analysis for Research and Applications Version 2 (NASA MERRA2) (Gelaro et al (2017)), have been added to the ENS ONI, further improving the overall quality of the index and accompanying estimates of inter-dataset spread, especially for the 1871-1900 period when few datasets are available and most SST reconstructions (e.g. HADISST1) that rely on modern ENSO behavior to reconstruct ENSO when data coverage is sparse, may underestimate the amplitude of major ENSO events like 1877-78 (Giese and Ray (2011)).
For comparison purposes and to further validate the legitimacy of ENS ONI's first-order estimates of structural uncertainty that emerge between datasets, ENS ONI's inter-dataset spread is now also directly accompanied by other published estimates of NINO 3.4 region spread from NOAA's 20CRv3 (Slivinski et al (2019)) and HADISST2 (Titchner and Rayner (2014)) (See figure and the excel sheet below).
The previous quality control procedure used to filter out potentially spurious data was discontinued as the median used to derive the index here is fairly robust to outliers.
An additional excel sheet with peak ENSO event intensities (in °C) has been added to the list of deliverables provided below on this web page.
October 2020: HADISST2.1 was added to the ENS ONI, significantly increasing the quality of the ENS ONI prior to 1900, and the new quality control procedure used to filter out potentially spurious data in the ENS ONI is significantly less stringent. OISSTv2 was upgraded to OISSTv2.1, which may slightly impact recent ENS ONI data.
ENS ONI now uses median SSTs instead of mean SSTs from available datasets at each time step to better protect the ENS ONI against outliers and preserve the amplitude of pre-1950 ENSO events. Utilizing the median SST also more accurately depicts well known asymmetries in ENSO amplitude stemming from more efficient Bjerknes feedbacks and stronger non-linearities between SSTs, surface winds, and locally forced convection in El Ninos. To better reflect this asymmetry, ENSO event intensity definitions were altered from, with "Super La Nina" no longer being utilized. However, keeping in spirit of the original ONI, ENS ONI still utilizes 3-month running means of monthly ONI values to determine tri-monthly ENS ONI values. The ENS ONI is also now accompanied by uncertainty estimates, determined by inter-dataset spread at each monthly time step, approximated as 2σ, generally corresponding to 95% level statistical significance.
July 2019: ERA-5 was added to the analysis & interpolated to a 1x1 degree grid to make it more comparable to other datasets used in the ENS ONI. Its addition resulted in little notable change in the ENS ONI after 1964. The ENS ONI quality control procedure was reevaluated for the 1877-78 El Nino, resulting in more realistic amplitude evolution during the growth phase of this "Super" El Nino in 1877. Changes in the 1877-78 El Nino also implicated nearby portions of the record, leading to an extremely modest modification of other ONI values from 1865 to 1890.
June 2019: HADSST4 was added to the analysis, resulting in a slight increase in amplitude of most pre-1950 ENSO events due to better constraint of quality control procedures. The standard deviation of available SST datasets used in the ENS ONI is now also provided.
Introduction
The Ensemble Oceanic NINO Index (ENS-ONI) is one of the longest running, real-time, instrumentally-based ENSO indices that has been developed to date, spanning from the mid 19th century to the present. The ENS ONI also arguably provides the most complete and up-to-date description of structural uncertainty amongst a multitude of SST reconstructions and reanalyses (for more on structural uncertainties see: Kennedy (2014)). The ENS ONI closely follows the methodology of the Climate Prediction Center (CPC), and is computed by using seasonally averaged sea surface temperature (SST) anomalies in the NINO 3.4 region (5S-5N, 120-170W) over the Equatorial Pacific as defined by Barnston et al (1997) using 32 SST and reanalysis datasets (unlike CPC's ONI which only uses Extended Reconstructed Sea Surface Temperature Version 5 (ERSSTv5) (see Huang et al (2017) ). Following the Barnston et al (1997) publication, and the realization that the NINO 3.4 index was highly correlated with other measures of ENSO (figures 2 and 3 above), the NINO 3.4 index became one of the most popular ENSO indices at the turn of the 21st century. The rather exceptional combined intensity and longevity of the 2014-16 multi-year "Super" El Nino event in the context of modern single-year modern "Super" El Nino events in 1972-73, 1982-83, & 1997-98 spurred the creation of the ENS ONI. The ENS ONI attempts to provide as long and reliable of an instrumentally-based ENSO record as possible maintaining simplicity in its construction and being available in real-time, while also providing uncertainty estimates. While the quality and quantity of data platforms and spatiotemporal coverage is relatively less reliable, less numerous, and more sparse respectively, the number of ENSO event samples under the ENS ONI is more than double the modern "reliable" record (1950-present).
Aside from the large number number of datasets and uncertainty estimates, one of the primary methodological differences between the ENS ONI and the CPC ONI is the choice to use climatological base periods based on median SSTs instead of mean SST. This allows the ENS ONUI to better characterize ENSO asymmetry, as SST climatologies may be slightly skewed towards El Ninos (e.g. An & Jin (2004)) and makes the ENS ONI more robust to outliers, which is important early in the record when SST uncertainty is large and there are few(er) datasets available to constrain the ENS ONI. A more detailed description of methods is described in Webb and Magi (2021)
The ENS ONI is intended to be a predecessor product to the Extended MEI version 2 (MEI.extv2), which is currently in production. For more on MEI.extv2 see my 100th Annual American Meteorological Society (AMS) Conference poster presentation: "Reanalysis of the Extended Multivariate ENSO Index"
2020 Master's Thesis on the "Reanalysis of the Extended Multivariate ENSO Index"
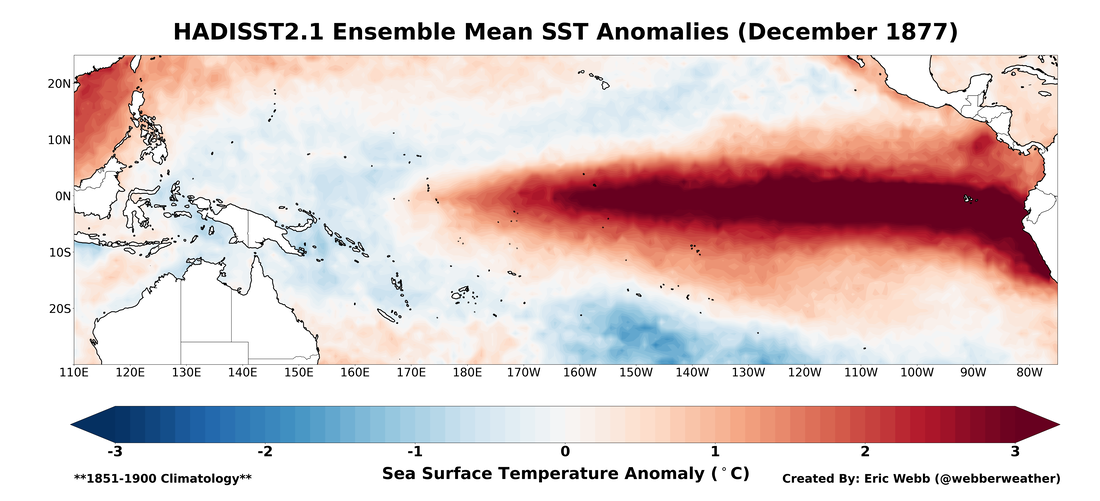
Figure 4. December 1877 Tropical Pacific sea surface temperature anomalies via mean of HADISST2.1's 10 ensemble members
Created in Python v3.9
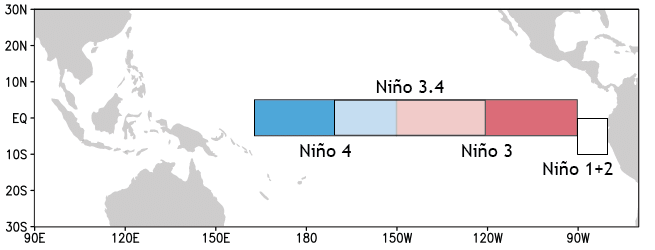
Figure 5. NINO SST regions
NINO 1+2: (0°-10°S, 80-90°W), NINO 3: (5°N-5°S, 90°W-150°W), NINO 3.4 (5°N-5°S, 120°W-170°W), NINO 4 (5°N-5°S, 160°E-150°W)
NINO 1+2: (0°-10°S, 80-90°W), NINO 3: (5°N-5°S, 90°W-150°W), NINO 3.4 (5°N-5°S, 120°W-170°W), NINO 4 (5°N-5°S, 160°E-150°W)
Data
The ENS ONI utilizes World Meteorological Organization (WMO) 30 year climatological base periods that are updated every 5 years (Table 1) to account for significant changes and inhomogeneities in the background climatic and observational mean state in the last few centuries. Raw data rounded to the nearest 0.01C was attained and datasets such as Kaplan's Extended SST Version 2, were converted from anomalies to raw data using their respective climatologies.
Although this index exhibits very robust correlations with the Bivariate ENSO Timeseries (BEST), Multivariate ENSO Index (MEI), Extended Multivariate ENSO Index (MEI.ext), this product should be used with caution, especially for prior to 1877 and in/around the first and second World War. The following 32 sea surface temperature, satellite, and reanalysis datasets were utilized in the creation of the ENS ONI at a grid spacing that varied between 1°x1° and 5°x5° latitude and longitude to ensure all were resolving the same types of phenomena in their respective fields. If these datasets weren't explicitly provided with this grid spacing, they were averaged over a number of grid boxes until this criteria was met.
HADISST2.1 (1850-2010)
COBE SST 2 (1850-2019)
HADSST4 (1850-2021)
NOAAs 20th Century Reanalysis Version 3 (1850-2015)
NOAAs 20th Century Reanalysis Version 2c (1854-2014)
ERSST Version 5 (1854-Present)
ERSST Version 4 (1854-2020)
Kaplan's Extended SST Version 2 (1856-2023)
HADISST (1870-Present)
NOAAs 20th Century Reanalysis Version 2 (1871-2012)
SODAv2.2.4 (1871-2010)
IOCADSv3 (1878-2020)
ERSST Version 3b (1880-2020)
COBE SST (1891-Present)
ERA-20CM (1900-2010)
ERA-20C (1900-2010)
CERA-20C (1901-2010)
NCEP/NCAR Reanalysis Version 1 (1948-Present)
HADSST2 (1950-2014)
HADSST3 (1950-2020)
ERA-5 (1950-Present)
WHOI OA Flux Version 3 (1958-2019)
ECMWF ORAS5 (1958-2019)
Climate Analysis Center (CAC) (now known as the CPC) SST (1970-March 2003)
NCEP CFSR (1979-2015)
NCEP DOE R2 (1979-Present)
ERA-Interim (1979-2019)
NASA MERRA (1979-2016)
NASA MERRA2 (1980-2023)
European Space Agency SST Climate Change Initiative (Sep 1981 - 1988) (ESA SST CCI)
Operational Sea Surface Temperature & Sea Ice Analysis (OSTIA) (Oct 1981-Present)
OISSTv1 (1 degree) (Nov 1981-March 2003)
OISSTv2.1 (1 degree) (Nov 1981-Present)
Aqua/MODIS SST (1 degree) (July 2002-Present)
Coral Reef Watch (CRW) SST (Apr 1985-Present)
ODYSSEA SST (Jan 2021 - Present)
30-Year Climatological Base Period |
ENS ONI Values |
1850-1879 |
1850-1867 |
1855-1884 |
1868-1872 |
1860-1889 |
1873-1877 |
1865-1894 |
1878-1882 |
1870-1899 |
1883-1887 |
1875-1904 |
1888-1892 |
1880-1909 |
1893-1897 |
1885-1914 |
1898-1902 |
1890-1919 |
1903-1907 |
1895-1924 |
1908-1912 |
1900-1929 |
1913-1917 |
1905-1934 |
1918-1922 |
1910-1939 |
1923-1927 |
1915-1944 |
1928-1932 |
1920-1949 |
1933-1937 |
1925-1954 |
1938-1942 |
1930-1959 |
1943-1947 |
1935-1964 |
1948-1952 |
1940-1969 |
1953-1957 |
1945-1974 |
1958-1962 |
1950-1979 |
1963-1967 |
1955-1984 |
1968-1972 |
1960-1989 |
1973-1977 |
1965-1994 |
1978-1982 |
1970-1999 |
1983-1987 |
1975-2004 |
1988-1992 |
1980-2009 |
1993-1997 |
1985-2014 |
1998-2002 |
1990-2019 |
2003-2021 |
Table 1. ENS ONI 30-year base periods (updated every 5 years) (left) with corresponding ENS ONI values (right).
Data for the ENS ONI was obtained via:
Climate Prediction Center (CPC): Monthly Atmospheric and SST Indices
Copernicus Marine Service
ECMWF Climate Reanalysis
ECMWF Copernicus Climate Change Service
Global Climate Observing System (GCOS) Working Group on Surface Pressure (WG-SP)
International Research Institute for Climate and Society
Koninklijk Nederlands Meteorologisch Instituut (KNMI) Climate Explorer
Met Office Hadley Centre observation datasets
NASA Earth Observations
NCAR's Research Data Archive
NOAA's Earth System Research Laboratory
NOAA's Science Data Integration Group Live Access Server
Pacific Islands Ocean Observing System (PacIOOS) ERDDAP
Discussion and analysis
Uncertainty in SST observations
Although the ENS ONI is comprised of a multitude of datasets with disparate spatial and temporal resolutions, and only utilizes SST anomalies in a seemingly inconsequential region of the equatorial Pacific, the standard deviation amongst various available datasets appears to be somewhat reflective of global trends during the instrumental record. This very crude estimate of parametric uncertainty reflects structural uncertainties amongst available datasets and their sensitivity to data input, which occurs because most datasets in the ENS ONI are effectively not constructed the same way and many datasets include different versions of ICOADS and/or other observational sources (especially reanalysis datasets) respectively. Both are important points regarding uncertainty in the instrumental record that tend to be less frequently discussed in literature. Nonetheless, from the standard deviation of SSTs in the NINO 3.4 region, three primary periods of contention and notable disagreement emerge from the observed record, namely before the 1877-78 "Super" El Nino, and during the first and second World Wars. The period before 1877-78 and the first World War is largely explained by a lack of data with the latter data outage being associated with ships being sunk during the war. The apparent discrepancy amongst available datasets in and around World War 2 however is multi-faceted, featuring both a similar loss of potential data from ships sunk in the war in addition to how SST observations were taken, with many ships switching from insulated bucket to engine room intake (ERI) measurements of SST and sampling more frequently during the daytime. This paradigm shift in SST collection strategies in/around World War 2 is potentially attributable to safer wartime sampling conditions during daylight as utilization of lights on-board at night to carry out more traditional bucket measurements of SST could attract enemy ships (Freeman et al (2017), Kent et al (2017) (also see figure 6 below). A comparison of the ENS ONI's uncertainty estimate against the HADISST2.1 ensemble and NOAA 20CRv3 is also shown in figure 7 and available for download further down the page.
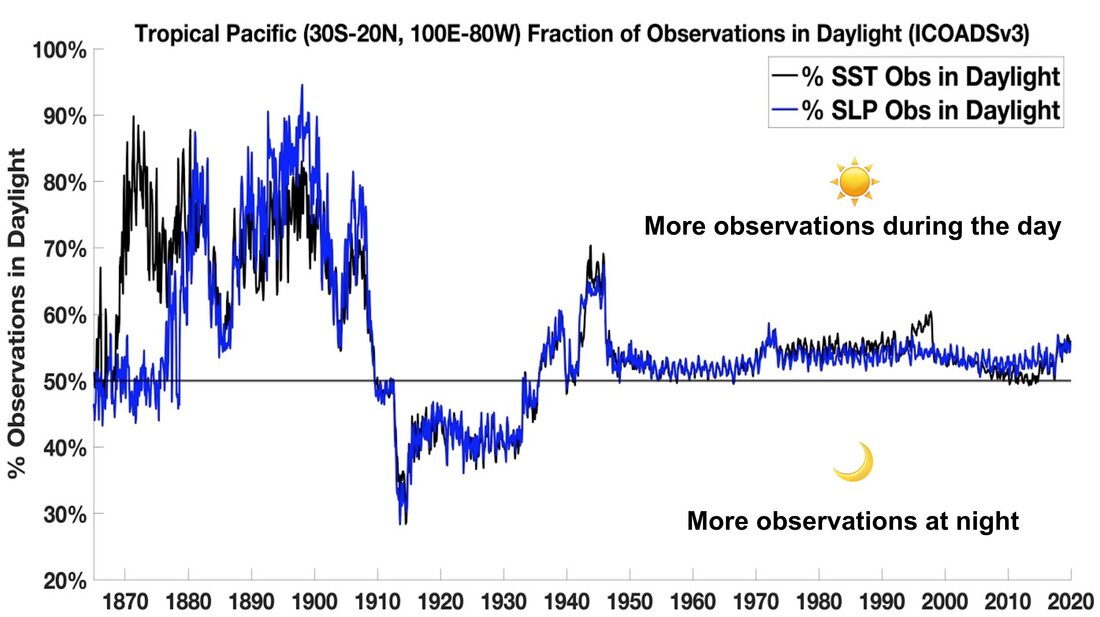
Figure 6. ICOADS R3.0 Tropical Pacific [30S-20N, 100E-80W] percent of SST (black) and SLP (blue) observations made in daylight hours.
Created using Matlab 2019a
Created using Matlab 2019a
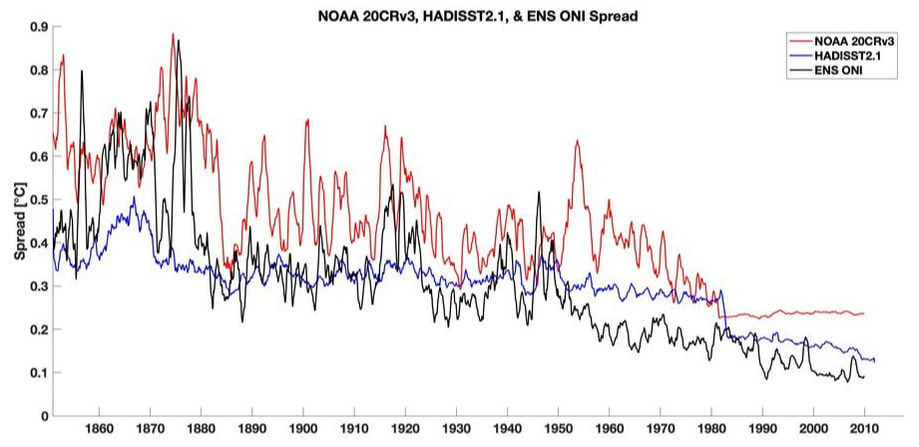
Figure 7. NOAA's 20th Century Reanalysis Version 3 (NOAA 20CRv3) (red), Hadley Centre Sea Ice and Sea Surface Temperature version 2.1 (HADISST2.1) (blue), & Ensemble Oceanic Nino Index spread (black) (annually smoothed) (1851-2010)
Created using Matlab 2019a
Created using Matlab 2019a
COMPARING ENS ONI TO Independent proxy & documentary records
The potential for under-dispersiveness in how instrumental-based SST datasets and reanalyses may represent pre-modern era (or prior to 1950) ENSO variability due to similarity in methods from different dataset curators (e.g. (Giese and Ray (2011)), it's important to also look at independently-derived records of ENSO (namely, proxy (tree rings, ice cores, corals, etc.) and documentary/written records) that don't have any dependence whatsoever on instrumentally-based derivations of SST. Doing so allows for an independent evaluation of instrumentally-based records of ENSO prior to the modern-era (~ 1950), when in-situ observations are sparse, and uncertainty in what limited data exists is much larger.
Here, 13 literature sources (Quinn et al (1987), Stahle et al (1998), Cook et al (2008), Braganza et al (2009), Gergis & Fowler et al (2009), McGregor et al (2010), Wilson et al (2010), Li et al (2011), Hakim et al (2016), Anderson et al (2019), Freund et al (2019), Tardif et al (2019), Dätwyler et al (2020), Sanchez et al (2020)) are utilized during their shared, overlapping period (1850-1977), Most of these proxy records have vastly different units and variables, and the written records are qualitative in their classification of ENSO. To facilitate a comparison amongst them, an approach modified from Wolter and Timlin (2011), whereby the annual percentile ranks are analyzed from all proxy + documentary records, and compared to the fraction of institution and literature based definitions (below) based on the Ensemble ONI. The upper, middle, and lower terciles represent El Niño, Neutral ENSO, and La Niña, respectively, except for Stahle et al (1998), which is an SOI-based proxy index where the signs are inverted. The annual fraction of proxy + documentary records that designate El Nino or La Nina conditions is shown by the black line, whereas the ENS ONI % of institution + literature definitions met shaded (red = El Nino, blue = La Nina). For reference, the ENS ONI time series is also plotted (bottom).
Overall, the agreement between instrumental and proxy + documentary records of ENSO is pretty strong even prior to 1950. Unsurprisingly, the largest discrepancies between these 2 independent sources of data exist during the 1850s. For example, proxy + documentary records suggest an El Nino in 1852-53 and a La Nina in 1863 are significantly muted/underestimated by instrumental data, whereas a moderately-intense La Nina depicted during the winter of 1856-57 in the ENS ONI may be an artifact.
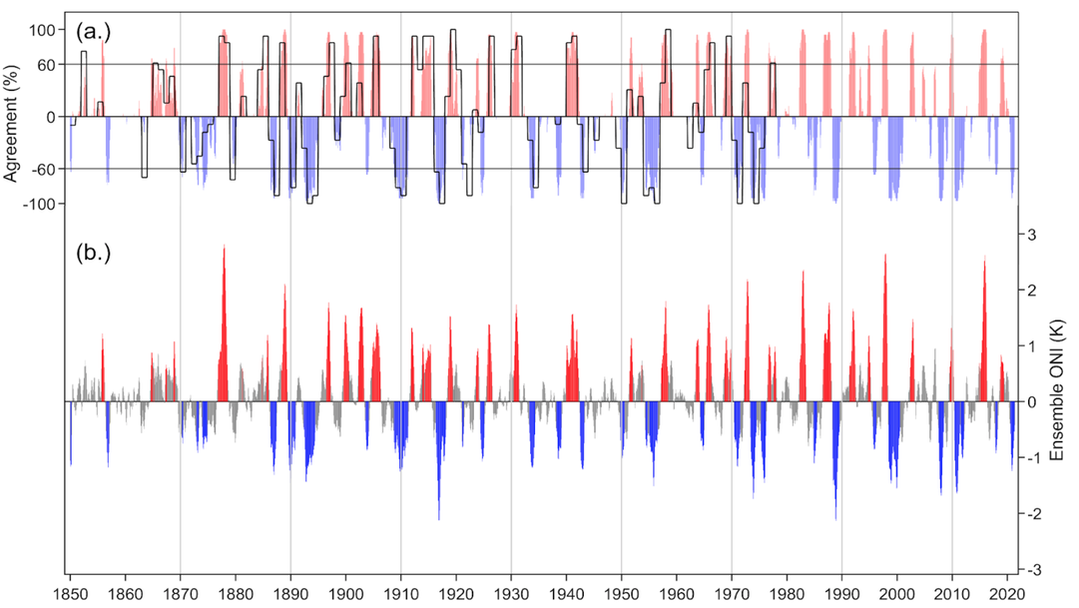
Figure 8 (from Webb and Magi (2021)): 1850–2021 time series of (a) the percent agreement with 33 literature-based definitions (see Table 2) of El Niño (positive values in light red) and La Niña (negative values in light blue), and the percent agreement with multiple proxy + documentary records of ENSO events from using percentile ranks for the overlapping 1850 to 1977 period (Wolter and Timlin (2011) methodology), except for documentary records, where ENSO phase/intensity is explicitly stated (e.g. Quinn et al (1987)), (black lines), and (b) the Ensemble ONI values shaded to only show El Niños (red) and La Niñas (blue) when greater than 60% of the literature-based definitions are met. Values in grey are when neither El Niño or La Niña conditions are met by greater than 60% of the definitions
ENSO phase and intensity
Attempts at reconstructing ENSO using multiple datasets and the Oceanic Nino Index has been attempted before as recently as Huang et al (2016), however their analysis was strictly limited to only several SST datasets and over the period 1950-present.
Following the methodology of Wolter and Timlin (2011), El Nino and La Nina tri-monthly periods are further binned into Weak, Moderate, Strong, and "Super" based on their tri-monthly ENS ONI percentiles shown below in table 2. El Ninos, Neutral, and La Nina are generally assumed to each occur roughly one-third of the time, however unlike Wolter and Timlin (2011), the ranks are flipped such that El Ninos occupy the lowest ranks and La Ninas the highest, we use all bi-monthly periods to rank ENSO instead of individual bi-monthly periods, and the El Nino and La Nina thresholds correspond to the lower tercile (33%) and uppermost tercile (67%) respectively as opposed to the end of the 3rd decile (30%) and beginning of the 7th decile (70%), which does not change the conclusions we draw here, although it increases the detectability of ENSO events ever-so-slightly in ENS ONI. The distribution of El Nino and La Ninas using the ENS ONI with NOAA CPC’s definition of 5 successive tri-monthly periods greater than or equal to +/-0.5C, found that La Nina and El Nino occur about 30% of the time. Therefore, the choice of ENSO threshold here is well within reason and similar to other popular ENSO indices and previous published studies.
Thus, going by the definition of ENSO noted here, El Ninos occur when the ENS ONI values are in the top 33% of all ENS ONI values for each tri-monthly period, while Neutral ENSO and La Nina correspond to the middle third and lower third of bi-monthlies respectively. Further distinctions to denote Weak, Moderate, Strong, and Super (very strong) ENSO events were also made here as was done with MEI.ext and MEI. Similar to Wolter and Timlin (2011), moderate El Ninos and moderate La Ninas were assumed to be ongoing when the MEI.extv2 bi-monthly percentiles were in the 2nd (10-20%) and 9th deciles (80-90%) respectively. Also similar to Wolter and Timlin (2011), the minimum threshold for Strong El Nino and Strong La Nina is defined as the 10th and 90th percentiles respectively.
A further distinction is made to identify extraordinarily powerful El Nino and La Nina events. The motivation for this is attributable to the fact that 4 very intense El Nino events (1877-78, 1982-83, 1997-98, 2015-16) are all more intense than not only any other El Nino, but all other ENSO events in the observed record. Furthermore, all of these El Ninos events have triggered exceptionally large and widespread climate anomalies across the globe, and the term “Super El Nino” has become increasingly popular and acceptable nomenclature in the atmospheric science community (Hameed et al (2018); Zhu et al (2018); Bing and Xie (2017); Chen et al (2016); Hong (2016); Latif et al (2015).
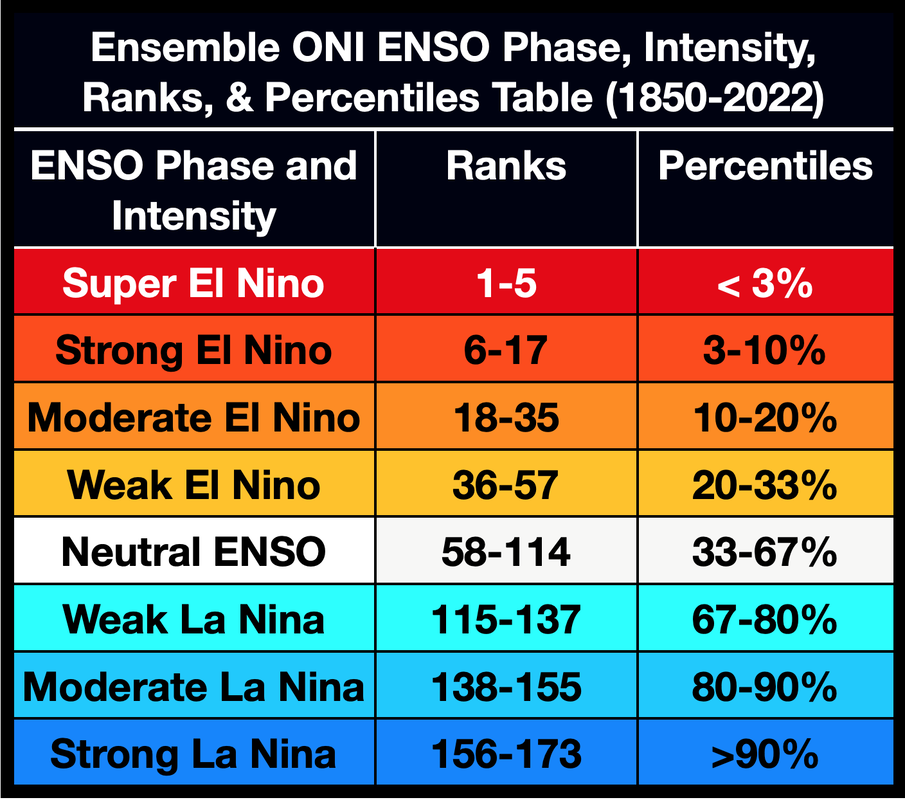
Table 2. ENS ONI ENSO phase and intensity (left), rank (middle), and percentiles (right). Generally analogous to Wolter & Timlin (2011)
Instead of using percentiles for each tri-monthly period as previously described, another of popular way of defining ENSO intensity, as is done by Jan Null, is to use the peak intensity of the totality of a boreal winter and/or ENSO event (Table 3). This leads to slightly different numbers of events in each classification compared to Table 2 above, but both methods are arguably equally valid ways of subjectively defining ENSO, depending on the preference and intentions of the user.
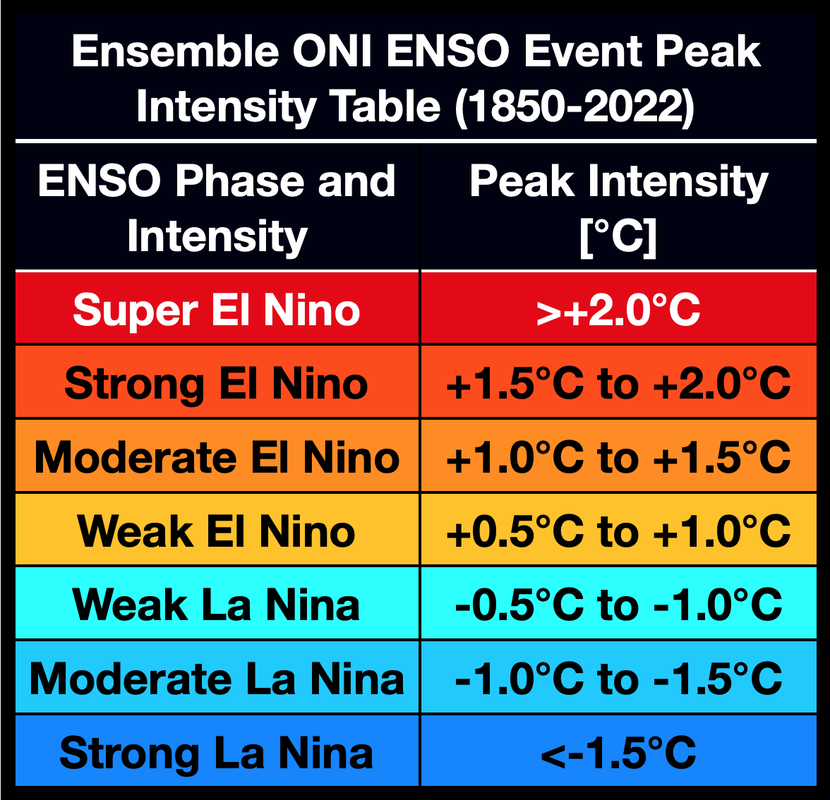
Table 3. ENS ONI ENSO phase (left) peak tri-monthly intensity (in °C) (right)
ENSO Event Phase and Peak Intensity List (1850-2024)
"Super" El Nino: 1877-78, 1888-89, 1972-73, 1982-83, 1997-98, & 2015-16
Strong El Nino: 1896-97, 1899-00, 1902-03, 1918-19, 1930-31, 1940-41, 1957-58, 1965-66, 1987-88, 1991-92, & 2009-10, 2023-24
Moderate El Nino: 1855-56, 1868-69, 1885-86, 1904-05, 1905-06, 1911-12, 1913-14, 1925-26, 1939-40, 1941-42, 1951-52, 1963-64, 1968-69, 1976-77, 1977-78, 1986-87, 1994-95, & 2002-03
Weak El Nino: 1852-53(?), 1864-65, 1865-66, 1867-68(?), 1868-69, 1876-77, 1880-81, 1883-84, 1884-85, 1887-88(?), 1891(?), 1895-96(?), 1900-01, 1914-15, 1919-20, 1929-30, 1923-24, 1952-53, 1953-54(?), 1958-59, 1969-70, 1979-80, 2004-05, 2006-07, 2014-15(?), 2018-19, & 2019-20(?)
Weak La Nina: 1869-70, 1870-71, 1872-73, 1873-74(?), 1874-75(?), 1879-80(?), 1898-99(?), 1903-04, 1906-07(?), 1908-09, 1910-11, 1915-16, 1917-18, 1921, 1922-23(?), 1938-39, 1944-45, 1950-51, 1954-55, 1956-57, 1964-65, 1971-72(?), 1974-75, 1978(?), 1983-84(?), 1989-90, 1995-96, 2000-01, 2005-06, 2008-09, 2016-17, 2017-18
Moderate La Nina: 1849-50, 1856-57, 1886-87, 1889-90, 1892-93, 1893-94, 1909-10, 1924-25, 1933-34, 1942-43, 1949-50, 1970-71, 1975-76, 1984-85, 1998-99, 2011-12, 2020-21, 2021-22, 2022-23
Strong La Nina: 1916-17, 1955-56, 1973-74, 1988-89, 1999-00, 2007-08, 2010-11
Table 4. ENSO Event Intensity List (1850-2024)
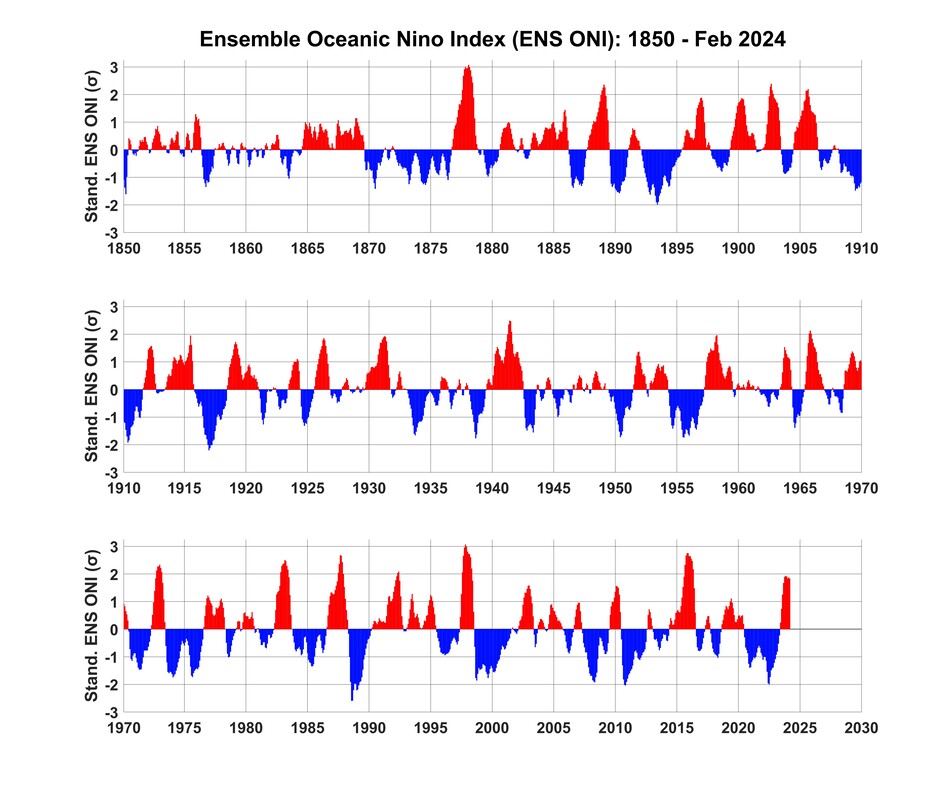
Figure 7. Standardized ENS ONI time series (1850 - Feb 2024) MEI.ext style
Created using Matlab 2022b
Created using Matlab 2022b
ENSO Definitions
Shown below is a table with 50 ENSO definitions based on either SST anomalies, SST standardized anomalies, or percentiles. The corresponding reference from where this definition originates is hyperlinked in the far left column. While the NOAA/CPC ONI definition (5 successive tri-monthly periods where SST anomalies are > +/- 0.5°C) is arguably the most commonly used in the scientific community, it's very far from the only one that's been frequently cited, utilized, and/or mentioned for real-time and post-mortem research based applications. Users of the ENS ONI should be aware that no matter how good any particular definition sounds or might seem, there is always some level of nuance involved, and that even slight modifications to a definition can lead to very different statistical and/or dynamical interpretations depending on the intention(s) of the individual and uncertainty in the underlying data. However, like combining a multitude of datasets, synthesizing a large ensemble of definitions from many prominent institutions and researchers increase the robustness, stability, and confidence that the output and conclusions derived from them are truly legitimate and significant.
This unique analysis of many ENSO definitions also allows us to obtain an estimate of opinions from experts in the field on what is and is not ENSO at some time "t" based on output from the ENS ONI; a crude measure of consensus.
Considering all of the above, it seems reasonable to believe that when at least a majority of the 50 definitions (25 of 50 (or more)) reach a consensus that an El Nino or La Nina is ongoing for a given monthly, bi-monthly, tri-monthly, and/or pentad period based on the ENS ONI, that an ENSO event is indeed probably, if not, likely ongoing. We will tentatively refer to this measure of ENSO as the ENS ONI Definitions Index. In order to ensure an apples-apples comparison between all the definitions, each one is given equivalent weight of up to 1 w/ a binary output (1 or 0/pass or fail) signaling the specified criteria in each definition was or was not met at a particular time step. To determine the time that this actually corresponds to for instances where tri-monthly or pentad averaged values of this ENS ONI are used, the middle month of that period is utilized. For ex, if we're looking at an ENSO definition that uses a pentad-averaged period to categorize ENSO and we're analyzing Oct-Feb (ONDJF), the binary output would be placed in the month of December, w/ January being used in place of NDJFM, etc. For bi-monthlies, these ENS ONI Definitions index values are binned into the first month of the bi-monthly period. To designate both El Ninos and La Ninas in this paradigm, La Nina (El Nino) values are negative (positive) and shaded blue (red).
Depicted in Table 6 is the ENS ONI Median Definitions Index for 2010-present. Raw values (0 to (+ or -) 50) are converted to percent, with values <-49(%) signifying that a majority of ENSO definitions recognize La Nina conditions, whereas values >+49 (%) correspond to where most definitions contend that El Nino conditions are occurring. Note that this definitions index will lag in real-time by a few months, due to the inclusion of literature-based ENSO definitions that are dependent on pentad (5-month) averaged data.
Hyperlinked Excel file for the ENS ONI definitions index (evaluated on the median SST anomaly value presented here)
ENS ONI Median Definition Index (1850 - Feb 2024)
**Assessments and further applications of this ENS ONI Definitions Index (esp as it pertains to uncertainty) are currently being experimented with and may be released in the future**
Institution/Reference(s) |
Criteria Amplitude |
Criteria Length |
> +/- 0.75°C SST |
1 tri-monthly |
|
> +/- 0.7σ SST |
3 tri-monthlies |
|
> +/- 0.8°C SST |
Any month |
|
> +/- 0.5°C SST |
6 consecutive pentads |
|
> +/- 0.75σ SST |
1 tri-monthly |
|
> +/- 1.0°C SST |
Any month |
|
> +/- 2.0°C SST |
Any month |
|
> +/- 0.5°C SST |
6 consecutive months |
|
> +/- 1.0°C SST |
1 tri-monthly |
|
El Nino: 25th %ile, La Nina: 75th %ile |
1 tri-monthly |
|
> +/- 1.0σ SST |
Any month |
|
El Nino: 25th %ile, La Nina: 75th %ile |
Any month |
|
> +/- 1.0σ SST |
4 consecutive months |
|
> +/- 0.7σ SST |
1 tri-monthly |
|
> +/- 0.5σ SST |
6 consecutive pentads |
|
> +/- 1.0σ SST |
3 consecutive months |
|
> +/- 1.0σ SST |
6 consecutive months |
|
> +/- 1.2σ SST |
Any month |
|
> +/- 0.5°C SST |
2 consecutive tri-monthlies |
|
> +/- 0.5σ SST |
Any month |
|
> +/- 1.0σ SST |
1 tri-monthly |
|
> +/- 0.6°C SST |
1 tri-monthly |
|
> +/- 0.5°C SST |
5 consecutive tri-monthlies |
|
> +/- 0.7σ SST |
4 month period |
|
> +/- 1.4°C SST |
1 tri-monthly |
|
> +/- 1.0°C SST |
1 tri-monthly |
|
> +/- 0.5°C SST |
5 consecutive months |
|
> +/- 0.75σ SST |
Any month |
|
> +/- 0.5σ SST |
1 tri-monthly |
|
El Nino: 33rd %ile, La Nina: 67th %ile |
1 pentad |
|
> +/- 0.5σ SST |
1 pentad |
|
> +/- 0.5σ SST |
5 consecutive pentads |
|
> +/- 0.4°C SST |
Any month |
|
> +/- 0.5°C SST |
Any month |
|
> +/- 0.4σ SST |
4 consecutive months |
|
> +/- 1.0°C SST |
3 consecutive months |
|
> +/- 0.4°C SST |
3 consecutive months |
|
> +/- 0.4°C SST |
6 consecutive tri-monthlies |
|
> +/- 1.0σ SST |
1 pentad |
|
> +/- 0.25°C SST |
5 consecutive tri-monthlies |
|
> +/- 0.5°C SST |
8 months |
|
> +/- 1.5°C SST |
1 tri-monthly |
|
> +/- 0.6°C SST |
1 pentad |
|
El Nino: 30th %ile, La Nina: 70th %ile |
1 bi-monthly |
|
> +/- 0.5σ SST |
5 consecutive months |
|
> +/- 0.5°C SST |
1 tri-monthly |
|
> +/- 0.4°C SST |
1 pentad |
|
> +/- 0.5°C SST |
1 pentad |
|
> +/- 1.0°C SST |
5 consecutive months |
|
> +/- 0.6σ SST |
1 tri-monthly |
Table 4. Institution and literature-based ENSO Definitions. From left-to-right Institution/reference(s) (left), criteria amplitude (middle), and criteria length (right)
|
ENS ONI Literature-Based Definitions Index (%
ENSO Definitions Met) |
||||||||||||
|
JAN |
FEB |
MAR |
APR |
MAY |
JUN |
JUL |
AUG |
SEP |
OCT |
NOV |
DEC |
|
|
2010 |
94% |
92% |
88% |
28% |
-4% |
-82% |
-94% |
-94% |
-98% |
-98% |
-98% |
-98% |
|
2011 |
-96% |
-94% |
-88% |
-86% |
-76% |
-40% |
-34% |
-62% |
-70% |
-82% |
-84% |
-84% |
|
2012 |
-70% |
-66% |
-60% |
-36% |
-12% |
0% |
2% |
22% |
16% |
2% |
0% |
0% |
|
2013 |
-4% |
-6% |
-2% |
-4% |
-16% |
-28% |
-18% |
-10% |
-2% |
0% |
0% |
0% |
|
2014 |
-2% |
-8% |
-2% |
0% |
0% |
4% |
0% |
0% |
2% |
20% |
44% |
42% |
|
2015 |
42% |
38% |
50% |
80% |
86% |
88% |
94% |
98% |
100% |
100% |
100% |
100% |
|
2016 |
100% |
100% |
98% |
86% |
18% |
0% |
-20% |
-42% |
-40% |
-46% |
-42% |
-32% |
|
2017 |
-6% |
0% |
0% |
0% |
2% |
4% |
2% |
0% |
-14% |
-48% |
-68% |
-68% |
|
2018 |
-68% |
-68% |
-68% |
-54% |
-16% |
0% |
0% |
0% |
12% |
54% |
66% |
68% |
|
2019 |
58% |
60% |
72% |
66% |
60% |
40% |
20% |
0% |
0% |
6% |
10% |
10% |
|
YR |
JAN |
FEB |
MAR |
APR |
MAY |
JUN |
JUL |
AUG |
SEP |
OCT |
NOV |
DEC |
|
2020 |
12% |
4% |
10% |
8% |
-4% |
-22% |
-32% |
-62% |
-82% |
-92% |
-92% |
-88% |
|
2021 |
-88% |
-82% |
-70% |
-62% |
-40% |
-18% |
-18% |
-32% |
-50% |
-80% |
-78% |
-80% |
|
2022 |
-74% |
-82% |
-92% |
-92% |
-92% |
-86% |
-84% |
-88% |
-88% |
-90% |
-86% |
-70% |
|
2023 |
-68% |
-34% |
-2% |
0% |
22% |
80% |
86% |
94% |
96% |
98% |
98% |
98% |
|
2024 |
- |
- |
- |
- |
- |
- |
- |
- |
- |
- |
- |
- |
Table 5. ENS ONI Definitions Index evaluated on the median ENS ONI value (in %) (2010-present).
ENS ONI Data
Given all the above, Data for the ENS ONI are available here as hyperlinks in Excel format:
Raw Monthly NINO 3.4 SST Input (1850 - Feb 2024)
Monthly NINO 3.4 SSTs (1850 - Feb 2024)
ENS ONI Median Definitions Index (1850 - Feb 2024)
ENS ONI Monthly Data (1850 - Feb 2024)
ENS ONI tri-monthly (CPC-like) data (1850 - Feb 2024)
ENS ONI standardized tri-monthly data (1850 - Feb 2024)
ENS ONI tri-monthly ranks (1850 - Feb 2024)
ENS ONI, NOAA 20CRv3, & HADISST2.1 uncertainty (1850 - Feb 2024)
The following ENS ONI table (also linked above) uses a modified version of Webb and Magi (2021)'s definition of ENSO. Here, 50 literature-based definitions (table 5) are used instead of 33, and if at least 50% of these ENSO definitions are met surrounding a particular month, it is recognized as a legitimate El Nino (red) or La Nina (blue), irrespective of the event's duration and/or potential discontinuities wrt adjacent months.
|
Ensemble Oceanic Nino
Index (ENS ONI) |
||||||||||||
|
YR |
DJF |
JFM |
FMA |
MAM |
AMJ |
MJJ |
JJA |
JAS |
ASO |
SON |
OND |
NDJ |
|
1850 |
-1.0 |
-1.1 |
-1.2 |
-0.6 |
-0.1 |
0.2 |
0.2 |
0.1 |
0.0 |
-0.1 |
-0.2 |
-0.1 |
|
1851 |
-0.2 |
-0.1 |
-0.1 |
0.1 |
0.2 |
0.1 |
0.2 |
0.2 |
0.3 |
0.4 |
0.3 |
0.2 |
|
1852 |
0.0 |
-0.1 |
-0.1 |
0.0 |
0.1 |
0.2 |
0.3 |
0.5 |
0.5 |
0.7 |
0.6 |
0.6 |
|
1853 |
0.3 |
0.1 |
0.1 |
0.1 |
0.1 |
0.1 |
-0.1 |
-0.1 |
-0.1 |
0.2 |
0.4 |
0.4 |
|
1854 |
0.3 |
0.2 |
0.2 |
0.2 |
0.4 |
0.3 |
0.1 |
-0.1 |
-0.1 |
-0.1 |
-0.3 |
-0.2 |
|
1855 |
0.1 |
0.4 |
0.4 |
0.3 |
0.2 |
0.0 |
-0.1 |
0.1 |
0.5 |
0.9 |
1.2 |
1.2 |
|
1856 |
1.0 |
0.9 |
0.6 |
0.3 |
-0.1 |
-0.3 |
-0.6 |
-0.8 |
-1.0 |
-0.9 |
-1.1 |
-1.1 |
|
1857 |
-0.9 |
-0.7 |
-0.4 |
-0.4 |
-0.1 |
0.0 |
0.0 |
0.0 |
0.1 |
0.2 |
0.1 |
0.1 |
|
1858 |
0.2 |
0.2 |
0.1 |
0.0 |
-0.1 |
-0.2 |
-0.3 |
-0.3 |
-0.1 |
0.1 |
0.1 |
0.1 |
|
1859 |
0.0 |
0.0 |
-0.2 |
-0.3 |
-0.3 |
-0.1 |
0.1 |
0.2 |
0.1 |
0.0 |
0.1 |
0.1 |
|
YR |
DJF |
JFM |
FMA |
MAM |
AMJ |
MJJ |
JJA |
JAS |
ASO |
SON |
OND |
NDJ |
|
1860 |
-0.1 |
-0.3 |
-0.4 |
-0.3 |
-0.2 |
0.0 |
0.0 |
0.1 |
0.0 |
-0.1 |
-0.3 |
-0.2 |
|
1861 |
0.0 |
0.0 |
0.0 |
-0.2 |
-0.2 |
-0.1 |
0.1 |
0.1 |
0.1 |
0.0 |
0.0 |
0.0 |
|
1862 |
0.1 |
0.2 |
0.2 |
0.1 |
0.2 |
0.3 |
0.3 |
0.2 |
0.0 |
-0.3 |
-0.4 |
-0.5 |
|
1863 |
-0.3 |
-0.2 |
-0.1 |
-0.4 |
-0.5 |
-0.6 |
-0.4 |
-0.3 |
-0.2 |
-0.1 |
0.0 |
0.0 |
|
1864 |
0.0 |
-0.1 |
-0.1 |
-0.1 |
-0.1 |
-0.1 |
0.1 |
0.3 |
0.6 |
0.9 |
0.9 |
0.8 |
|
1865 |
0.7 |
0.8 |
0.6 |
0.4 |
0.2 |
0.4 |
0.5 |
0.4 |
0.3 |
0.4 |
0.6 |
0.9 |
|
1866 |
0.9 |
0.7 |
0.5 |
0.4 |
0.4 |
0.4 |
0.4 |
0.3 |
0.1 |
0.1 |
0.1 |
0.2 |
|
1867 |
0.1 |
0.1 |
0.0 |
0.3 |
0.5 |
0.6 |
0.5 |
0.4 |
0.4 |
0.5 |
0.5 |
0.6 |
|
1868 |
0.6 |
0.6 |
0.4 |
0.4 |
0.4 |
0.4 |
0.3 |
0.2 |
0.4 |
0.8 |
1.1 |
1.1 |
|
1869 |
0.9 |
0.7 |
0.5 |
0.3 |
0.3 |
0.3 |
0.1 |
-0.3 |
-0.6 |
-0.6 |
-0.4 |
-0.5 |
|
YR |
DJF |
JFM |
FMA |
MAM |
AMJ |
MJJ |
JJA |
JAS |
ASO |
SON |
OND |
NDJ |
|
1870 |
-0.6 |
-0.6 |
-0.5 |
-0.6 |
-0.7 |
-0.8 |
-0.6 |
-0.4 |
-0.3 |
-0.4 |
-0.5 |
-0.4 |
|
1871 |
-0.3 |
-0.1 |
0.0 |
0.0 |
0.0 |
-0.2 |
-0.2 |
-0.2 |
0.0 |
0.0 |
0.1 |
0.1 |
|
1872 |
0.0 |
-0.2 |
-0.2 |
-0.3 |
-0.3 |
-0.3 |
-0.3 |
-0.4 |
-0.5 |
-0.5 |
-0.6 |
-0.6 |
|
1873 |
-0.7 |
-0.7 |
-0.8 |
-0.7 |
-0.5 |
-0.3 |
-0.2 |
-0.1 |
-0.1 |
-0.1 |
-0.2 |
-0.3 |
|
1874 |
-0.5 |
-0.7 |
-0.8 |
-0.7 |
-0.7 |
-0.7 |
-0.7 |
-0.8 |
-0.8 |
-0.7 |
-0.7 |
-0.5 |
|
1875 |
-0.3 |
-0.2 |
-0.3 |
-0.3 |
-0.4 |
-0.5 |
-0.5 |
-0.6 |
-0.5 |
-0.4 |
-0.2 |
-0.1 |
|
1876 |
-0.2 |
-0.3 |
-0.5 |
-0.5 |
-0.6 |
-0.4 |
-0.3 |
-0.1 |
0.1 |
0.4 |
0.7 |
0.9 |
|
1877 |
0.9 |
1.0 |
1.0 |
1.0 |
0.9 |
1.0 |
1.3 |
1.8 |
2.2 |
2.6 |
2.8 |
2.9 |
|
1878 |
2.9 |
2.5 |
2.0 |
1.6 |
1.3 |
1.0 |
0.6 |
0.3 |
0.1 |
0.0 |
-0.1 |
-0.2 |
|
1879 |
-0.2 |
-0.1 |
0.0 |
-0.1 |
-0.3 |
-0.4 |
-0.5 |
-0.6 |
-0.6 |
-0.5 |
-0.5 |
-0.7 |
|
DJF |
JFM |
FMA |
MAM |
AMJ |
MJJ |
JJA |
JAS |
ASO |
SON |
OND |
NDJ |
|
|
1880 |
-0.6 |
-0.5 |
-0.3 |
-0.3 |
-0.2 |
-0.1 |
0.0 |
0.1 |
0.4 |
0.5 |
0.7 |
0.8 |
|
1881 |
0.7 |
0.7 |
0.6 |
0.6 |
0.5 |
0.4 |
0.3 |
0.2 |
0.1 |
0.1 |
0.0 |
0.0 |
|
1882 |
-0.1 |
0.0 |
0.1 |
0.2 |
0.2 |
0.1 |
-0.1 |
-0.2 |
-0.2 |
-0.3 |
-0.3 |
-0.2 |
|
1883 |
-0.1 |
0.2 |
0.3 |
0.4 |
0.3 |
0.3 |
0.2 |
0.2 |
0.1 |
0.2 |
0.2 |
0.3 |
|
1884 |
0.3 |
0.4 |
0.5 |
0.5 |
0.4 |
0.4 |
0.4 |
0.5 |
0.6 |
0.8 |
0.9 |
1.0 |
|
1885 |
0.8 |
0.5 |
0.3 |
0.2 |
0.3 |
0.4 |
0.4 |
0.4 |
0.8 |
1.2 |
1.3 |
1.2 |
|
1886 |
0.8 |
0.3 |
-0.1 |
-0.3 |
-0.5 |
-0.7 |
-0.8 |
-0.8 |
-0.8 |
-0.8 |
-1.0 |
-1.1 |
|
1887 |
-1.2 |
-1.0 |
-0.9 |
-0.7 |
-0.6 |
-0.3 |
-0.2 |
0.0 |
0.1 |
0.3 |
0.5 |
0.5 |
|
1888 |
0.7 |
0.7 |
0.7 |
0.6 |
0.6 |
0.7 |
0.8 |
1.0 |
1.3 |
1.7 |
2.0 |
2.2 |
|
1889 |
2.2 |
1.9 |
1.4 |
0.9 |
0.6 |
0.1 |
-0.4 |
-0.8 |
-1.0 |
-1.1 |
-1.1 |
-1.4 |
|
YR |
DJF |
JFM |
FMA |
MAM |
AMJ |
MJJ |
JJA |
JAS |
ASO |
SON |
OND |
NDJ |
|
1890 |
-1.4 |
-1.3 |
-1.1 |
-0.9 |
-0.8 |
-0.7 |
-0.7 |
-0.7 |
-0.8 |
-0.8 |
-0.6 |
-0.3 |
|
1891 |
0.0 |
0.1 |
0.3 |
0.3 |
0.4 |
0.4 |
0.4 |
0.3 |
0.3 |
0.3 |
0.3 |
0.1 |
|
1892 |
0.0 |
-0.1 |
-0.3 |
-0.4 |
-0.5 |
-0.5 |
-0.7 |
-0.9 |
-1.2 |
-1.4 |
-1.4 |
-1.2 |
|
1893 |
-1.1 |
-1.1 |
-1.1 |
-1.1 |
-1.1 |
-1.0 |
-1.0 |
-1.0 |
-1.1 |
-1.1 |
-0.9 |
-0.9 |
|
1894 |
-0.9 |
-0.9 |
-0.8 |
-0.8 |
-0.7 |
-0.6 |
-0.4 |
-0.4 |
-0.4 |
-0.5 |
-0.4 |
-0.4 |
|
1895 |
-0.3 |
-0.2 |
-0.2 |
-0.1 |
0.0 |
0.0 |
0.2 |
0.3 |
0.5 |
0.6 |
0.7 |
0.6 |
|
1896 |
0.4 |
0.3 |
0.3 |
0.2 |
0.2 |
0.4 |
0.7 |
1.0 |
1.2 |
1.5 |
1.8 |
1.8 |
|
1897 |
1.7 |
1.3 |
0.8 |
0.3 |
0.0 |
0.1 |
0.1 |
0.1 |
0.0 |
-0.2 |
-0.3 |
-0.3 |
|
1898 |
-0.3 |
-0.4 |
-0.4 |
-0.4 |
-0.3 |
-0.3 |
-0.5 |
-0.5 |
-0.5 |
-0.4 |
-0.4 |
-0.5 |
|
1899 |
-0.5 |
-0.4 |
-0.2 |
0.0 |
0.2 |
0.3 |
0.4 |
0.5 |
0.8 |
1.2 |
1.5 |
1.7 |
|
DJF |
JFM |
FMA |
MAM |
AMJ |
MJJ |
JJA |
JAS |
ASO |
SON |
OND |
NDJ |
|
|
1900 |
1.6 |
1.5 |
1.3 |
1.1 |
1.0 |
0.9 |
0.7 |
0.6 |
0.5 |
0.4 |
0.5 |
0.5 |
|
1901 |
0.6 |
0.5 |
0.4 |
0.2 |
0.1 |
0.0 |
0.0 |
0.0 |
0.0 |
0.0 |
0.0 |
0.0 |
|
1902 |
0.1 |
0.2 |
0.4 |
0.5 |
0.8 |
1.1 |
1.3 |
1.5 |
1.6 |
1.7 |
1.8 |
1.8 |
|
1903 |
1.6 |
1.4 |
1.1 |
0.7 |
0.3 |
-0.1 |
-0.3 |
-0.5 |
-0.6 |
-0.7 |
-0.8 |
-0.8 |
|
1904 |
-0.7 |
-0.5 |
-0.5 |
-0.3 |
-0.1 |
0.1 |
0.4 |
0.4 |
0.6 |
0.7 |
0.9 |
1.1 |
|
1905 |
1.1 |
1.1 |
1.0 |
1.0 |
1.0 |
1.2 |
1.3 |
1.4 |
1.4 |
1.3 |
1.3 |
1.3 |
|
1906 |
1.3 |
1.1 |
0.9 |
0.6 |
0.3 |
0.0 |
-0.3 |
-0.4 |
-0.5 |
-0.5 |
-0.4 |
-0.3 |
|
1907 |
-0.4 |
-0.4 |
-0.4 |
-0.3 |
-0.2 |
-0.1 |
-0.1 |
0.0 |
0.1 |
0.1 |
0.0 |
0.0 |
|
1908 |
0.0 |
-0.1 |
-0.3 |
-0.5 |
-0.4 |
-0.4 |
-0.3 |
-0.4 |
-0.5 |
-0.7 |
-0.7 |
-0.8 |
|
1909 |
-0.8 |
-0.8 |
-0.7 |
-0.6 |
-0.7 |
-0.8 |
-0.8 |
-0.9 |
-1.0 |
-1.1 |
-1.1 |
-1.1 |
|
YR |
DJF |
JFM |
FMA |
MAM |
AMJ |
MJJ |
JJA |
JAS |
ASO |
SON |
OND |
NDJ |
|
1910 |
-1.1 |
-1.2 |
-1.2 |
-1.1 |
-1.0 |
-0.9 |
-0.8 |
-0.9 |
-0.9 |
-0.9 |
-0.7 |
-0.6 |
|
1911 |
-0.6 |
-0.6 |
-0.7 |
-0.6 |
-0.4 |
-0.2 |
0.1 |
0.2 |
0.3 |
0.6 |
1.1 |
1.4 |
|
1912 |
1.4 |
1.3 |
1.1 |
0.9 |
0.6 |
0.3 |
0.1 |
-0.1 |
-0.1 |
-0.1 |
-0.1 |
-0.1 |
|
1913 |
-0.1 |
-0.1 |
0.0 |
0.0 |
0.0 |
0.2 |
0.3 |
0.4 |
0.3 |
0.4 |
0.7 |
1.0 |
|
1914 |
1.1 |
0.9 |
0.7 |
0.6 |
0.6 |
0.6 |
0.7 |
0.8 |
0.8 |
0.8 |
0.8 |
1.0 |
|
1915 |
1.0 |
1.0 |
0.9 |
0.9 |
1.1 |
0.9 |
0.6 |
0.1 |
-0.1 |
-0.1 |
-0.3 |
-0.5 |
|
1916 |
-0.6 |
-0.4 |
-0.3 |
-0.3 |
-0.5 |
-0.8 |
-1.0 |
-1.1 |
-1.4 |
-1.7 |
-2.1 |
-2.1 |
|
1917 |
-1.9 |
-1.7 |
-1.3 |
-1.1 |
-0.8 |
-0.7 |
-0.6 |
-0.6 |
-0.7 |
-0.9 |
-1.0 |
-0.9 |
|
1918 |
-0.7 |
-0.6 |
-0.4 |
-0.3 |
0.1 |
0.2 |
0.5 |
0.6 |
0.8 |
1.1 |
1.4 |
1.6 |
|
1919 |
1.6 |
1.4 |
1.1 |
0.8 |
0.6 |
0.5 |
0.3 |
0.2 |
0.3 |
0.5 |
0.6 |
0.6 |
|
YR |
DJF |
JFM |
FMA |
MAM |
AMJ |
MJJ |
JJA |
JAS |
ASO |
SON |
OND |
NDJ |
|
1920 |
0.8 |
0.7 |
0.6 |
0.3 |
0.3 |
0.2 |
0.3 |
0.3 |
0.3 |
0.2 |
0.1 |
-0.1 |
|
1921 |
-0.3 |
-0.6 |
-0.8 |
-0.8 |
-0.6 |
-0.5 |
-0.3 |
0.0 |
0.0 |
-0.1 |
-0.1 |
-0.1 |
|
1922 |
0.0 |
0.0 |
0.0 |
0.0 |
-0.1 |
-0.1 |
-0.4 |
-0.5 |
-0.5 |
-0.3 |
-0.3 |
-0.4 |
|
1923 |
-0.5 |
-0.4 |
-0.3 |
0.0 |
0.1 |
0.2 |
0.3 |
0.5 |
0.7 |
0.9 |
0.9 |
1.0 |
|
1924 |
1.0 |
0.9 |
0.5 |
0.1 |
-0.3 |
-0.6 |
-0.7 |
-0.9 |
-0.9 |
-1.0 |
-1.0 |
-1.0 |
|
1925 |
-0.8 |
-0.6 |
-0.3 |
-0.2 |
-0.1 |
0.1 |
0.3 |
0.5 |
0.7 |
1.0 |
1.2 |
1.4 |
|
1926 |
1.5 |
1.5 |
1.3 |
1.1 |
0.9 |
0.7 |
0.5 |
0.3 |
0.0 |
-0.2 |
-0.3 |
-0.2 |
|
1927 |
-0.1 |
-0.1 |
-0.2 |
-0.3 |
-0.2 |
-0.2 |
-0.1 |
-0.1 |
0.1 |
0.1 |
0.2 |
0.3 |
|
1928 |
0.4 |
0.3 |
0.1 |
0.0 |
0.0 |
0.0 |
-0.1 |
-0.1 |
-0.1 |
0.0 |
0.1 |
0.1 |
|
1929 |
0.1 |
-0.1 |
-0.1 |
-0.1 |
0.0 |
0.0 |
0.0 |
0.2 |
0.4 |
0.5 |
0.5 |
0.6 |
|
YR |
DJF |
JFM |
FMA |
MAM |
AMJ |
MJJ |
JJA |
JAS |
ASO |
SON |
OND |
NDJ |
|
1930 |
0.7 |
0.7 |
0.5 |
0.5 |
0.5 |
0.5 |
0.6 |
0.8 |
1.1 |
1.4 |
1.6 |
1.8 |
|
1931 |
1.7 |
1.6 |
1.3 |
1.0 |
0.8 |
0.5 |
0.2 |
0.0 |
-0.1 |
-0.2 |
-0.2 |
-0.2 |
|
1932 |
-0.1 |
0.0 |
0.2 |
0.3 |
0.4 |
0.2 |
0.1 |
0.0 |
0.0 |
0.0 |
0.0 |
0.0 |
|
1933 |
-0.1 |
-0.2 |
-0.4 |
-0.4 |
-0.5 |
-0.7 |
-0.9 |
-1.1 |
-1.1 |
-1.1 |
-1.1 |
-1.1 |
|
1934 |
-1.1 |
-1.0 |
-0.8 |
-0.6 |
-0.4 |
-0.2 |
-0.1 |
-0.1 |
-0.1 |
-0.1 |
-0.1 |
-0.1 |
|
1935 |
-0.2 |
-0.2 |
-0.3 |
-0.3 |
-0.3 |
-0.3 |
-0.2 |
-0.1 |
0.2 |
0.4 |
0.4 |
0.4 |
|
1936 |
0.4 |
0.3 |
0.2 |
0.1 |
-0.1 |
-0.3 |
-0.4 |
-0.4 |
-0.3 |
-0.2 |
-0.1 |
-0.1 |
|
1937 |
0.1 |
0.1 |
0.2 |
0.1 |
0.0 |
-0.1 |
-0.1 |
0.0 |
0.1 |
0.2 |
0.1 |
0.0 |
|
1938 |
-0.2 |
-0.3 |
-0.5 |
-0.5 |
-0.6 |
-0.8 |
-1.0 |
-1.0 |
-0.9 |
-0.8 |
-0.8 |
-0.8 |
|
1939 |
-0.8 |
-0.7 |
-0.5 |
-0.2 |
0.0 |
0.1 |
0.2 |
0.2 |
0.2 |
0.1 |
0.1 |
0.5 |
|
YR |
DJF |
JFM |
FMA |
MAM |
AMJ |
MJJ |
JJA |
JAS |
ASO |
SON |
OND |
NDJ |
|
1940 |
0.8 |
1.0 |
0.9 |
0.9 |
0.7 |
0.6 |
0.7 |
0.7 |
0.8 |
0.8 |
1.1 |
1.4 |
|
1941 |
1.6 |
1.6 |
1.6 |
1.4 |
1.3 |
1.1 |
0.9 |
0.8 |
0.9 |
1.1 |
1.3 |
1.3 |
|
1942 |
1.1 |
0.8 |
0.6 |
0.4 |
0.2 |
-0.2 |
-0.6 |
-0.9 |
-1.1 |
-1.1 |
-1.2 |
-1.2 |
|
1943 |
-1.2 |
-1.1 |
-1.1 |
-0.8 |
-0.4 |
-0.1 |
0.1 |
0.1 |
-0.1 |
-0.2 |
-0.3 |
-0.3 |
|
1944 |
-0.2 |
-0.1 |
0.0 |
0.1 |
0.2 |
0.2 |
0.2 |
0.1 |
0.0 |
-0.2 |
-0.3 |
-0.3 |
|
1945 |
-0.4 |
-0.5 |
-0.7 |
-0.6 |
-0.3 |
-0.2 |
-0.2 |
-0.3 |
-0.1 |
0.0 |
0.0 |
0.0 |
|
1946 |
0.0 |
-0.1 |
-0.2 |
-0.2 |
-0.1 |
0.1 |
0.1 |
0.0 |
0.0 |
0.2 |
0.3 |
0.5 |
|
1947 |
0.4 |
0.3 |
0.1 |
0.0 |
0.0 |
0.1 |
0.1 |
0.1 |
0.0 |
-0.1 |
-0.1 |
0.0 |
|
1948 |
0.2 |
0.3 |
0.4 |
0.4 |
0.3 |
0.3 |
0.2 |
0.2 |
0.1 |
0.0 |
0.0 |
0.1 |
|
1949 |
0.1 |
0.0 |
0.0 |
0.0 |
-0.1 |
-0.2 |
-0.3 |
-0.2 |
-0.2 |
-0.4 |
-0.7 |
-0.9 |
|
DJF |
JFM |
FMA |
MAM |
AMJ |
MJJ |
JJA |
JAS |
ASO |
SON |
OND |
NDJ |
|
|
1950 |
-1.0 |
-1.0 |
-1.1 |
-1.0 |
-0.9 |
-0.8 |
-0.6 |
-0.6 |
-0.5 |
-0.5 |
-0.6 |
-0.7 |
|
1951 |
-0.7 |
-0.6 |
-0.3 |
-0.1 |
0.1 |
0.3 |
0.5 |
0.8 |
1.0 |
1.2 |
1.1 |
0.9 |
|
1952 |
0.7 |
0.5 |
0.4 |
0.3 |
0.1 |
-0.1 |
-0.1 |
0.0 |
0.2 |
0.3 |
0.2 |
0.3 |
|
1953 |
0.4 |
0.5 |
0.5 |
0.5 |
0.5 |
0.4 |
0.4 |
0.6 |
0.6 |
0.7 |
0.5 |
0.5 |
|
1954 |
0.4 |
0.3 |
0.0 |
-0.3 |
-0.6 |
-0.7 |
-0.8 |
-0.8 |
-0.7 |
-0.6 |
-0.6 |
-0.6 |
|
1955 |
-0.6 |
-0.6 |
-0.8 |
-0.8 |
-0.9 |
-0.9 |
-0.9 |
-0.9 |
-1.1 |
-1.4 |
-1.5 |
-1.4 |
|
1956 |
-1.1 |
-0.8 |
-0.7 |
-0.7 |
-0.8 |
-0.8 |
-0.7 |
-0.6 |
-0.5 |
-0.5 |
-0.5 |
-0.4 |
|
1957 |
-0.3 |
-0.0 |
-0.3 |
0.6 |
0.6 |
0.7 |
0.8 |
1.0 |
1.1 |
1.2 |
1.4 |
1.7 |
|
1958 |
1.8 |
1.6 |
1.2 |
0.8 |
0.6 |
0.5 |
0.5 |
0.4 |
0.3 |
0.3 |
0.5 |
0.6 |
|
1959 |
0.7 |
0.7 |
0.6 |
0.4 |
0.2 |
0.0 |
-0.1 |
-0.1 |
0.1 |
0.1 |
0.2 |
0.1 |
|
YR |
DJF |
JFM |
FMA |
MAM |
AMJ |
MJJ |
JJA |
JAS |
ASO |
SON |
OND |
NDJ |
|
1960 |
0.0 |
0.1 |
0.0 |
0.1 |
0.0 |
0.0 |
0.1 |
0.2 |
0.2 |
0.2 |
0.1 |
0.1 |
|
1961 |
0.1 |
0.1 |
0.0 |
0.0 |
0.0 |
0.1 |
0.0 |
-0.1 |
-0.1 |
-0.2 |
-0.1 |
-0.2 |
|
1962 |
-0.2 |
-0.2 |
-0.3 |
-0.3 |
-0.3 |
-0.3 |
-0.1 |
-0.1 |
-0.1 |
-0.2 |
-0.3 |
-0.3 |
|
1963 |
-0.4 |
-0.2 |
0.0 |
0.0 |
0.1 |
0.3 |
0.7 |
1.0 |
1.0 |
1.1 |
1.1 |
1.1 |
|
1964 |
1.0 |
0.6 |
0.1 |
-0.4 |
-0.6 |
-0.8 |
-0.7 |
-0.6 |
-0.7 |
-0.8 |
-0.9 |
-0.8 |
|
1965 |
-0.5 |
-0.2 |
-0.1 |
0.1 |
0.3 |
0.7 |
1.0 |
1.3 |
1.6 |
1.7 |
1.7 |
1.6 |
|
1966 |
1.4 |
1.2 |
1.0 |
0.6 |
0.4 |
0.3 |
0.3 |
0.3 |
0.2 |
0.1 |
0.0 |
-0.1 |
|
1967 |
-0.2 |
-0.3 |
-0.4 |
-0.3 |
-0.2 |
0.0 |
0.0 |
-0.1 |
-0.2 |
-0.2 |
-0.2 |
-0.3 |
|
1968 |
-0.4 |
-0.6 |
-0.6 |
-0.5 |
-0.2 |
0.1 |
0.4 |
0.4 |
0.5 |
0.7 |
0.9 |
1.1 |
|
1969 |
1.2 |
1.1 |
0.9 |
0.7 |
0.6 |
0.4 |
0.4 |
0.5 |
0.8 |
0.9 |
0.9 |
0.9 |
|
YR |
DJF |
JFM |
FMA |
MAM |
AMJ |
MJJ |
JJA |
JAS |
ASO |
SON |
OND |
NDJ |
|
1970 |
0.8 |
0.6 |
0.4 |
0.2 |
0.0 |
-0.4 |
-0.6 |
-0.7 |
-0.7 |
-0.7 |
-0.8 |
-1.0 |
|
1971 |
-1.1 |
-1.1 |
-1.0 |
-0.9 |
-0.8 |
-0.7 |
-0.6 |
-0.5 |
-0.6 |
-0.6 |
-0.7 |
-0.6 |
|
1972 |
-0.4 |
-0.2 |
0.1 |
0.3 |
0.5 |
0.8 |
1.1 |
1.4 |
1.7 |
1.9 |
2.2 |
2.2 |
|
1973 |
1.9 |
1.4 |
0.8 |
0.2 |
-0.3 |
-0.7 |
-0.9 |
-1.0 |
-1.1 |
-1.3 |
-1.5 |
-1.7 |
|
1974 |
-1.6 |
-1.4 |
-1.1 |
-0.8 |
-0.7 |
-0.6 |
-0.5 |
-0.3 |
-0.3 |
-0.5 |
-0.6 |
-0.5 |
|
1975 |
-0.3 |
-0.3 |
-0.4 |
-0.6 |
-0.7 |
-0.9 |
-1.0 |
-1.0 |
-1.1 |
-1.2 |
-1.3 |
-1.4 |
|
1976 |
-1.3 |
-1.0 |
-0.6 |
-0.4 |
-0.2 |
0.0 |
0.3 |
0.6 |
0.8 |
1.0 |
1.0 |
1.0 |
|
1977 |
0.9 |
0.7 |
0.4 |
0.3 |
0.3 |
0.4 |
0.4 |
0.5 |
0.6 |
0.9 |
1.0 |
0.9 |
|
1978 |
0.7 |
0.4 |
0.1 |
-0.3 |
-0.5 |
-0.6 |
-0.6 |
-0.5 |
-0.4 |
-0.3 |
-0.2 |
-0.1 |
|
1979 |
-0.1 |
0.0 |
0.2 |
0.2 |
0.1 |
0.0 |
0.0 |
0.2 |
0.4 |
0.5 |
0.4 |
0.5 |
|
YR |
DJF |
JFM |
FMA |
MAM |
AMJ |
MJJ |
JJA |
JAS |
ASO |
SON |
OND |
NDJ |
|
1980 |
0.4 |
0.3 |
0.2 |
0.2 |
0.3 |
0.2 |
0.0 |
-0.1 |
-0.1 |
0.0 |
0.0 |
-0.1 |
|
1981 |
-0.3 |
-0.5 |
-0.4 |
-0.3 |
-0.3 |
-0.4 |
-0.4 |
-0.3 |
-0.1 |
-0.2 |
-0.3 |
-0.3 |
|
1982 |
-0.2 |
0.0 |
0.1 |
0.4 |
0.7 |
0.7 |
0.8 |
1.1 |
1.6 |
1.9 |
2.2 |
2.3 |
|
1983 |
2.3 |
2.1 |
1.6 |
1.3 |
1.0 |
0.6 |
0.3 |
0.0 |
-0.2 |
-0.4 |
-0.7 |
-0.8 |
|
1984 |
-0.7 |
-0.5 |
-0.4 |
-0.4 |
-0.5 |
-0.5 |
-0.4 |
-0.2 |
-0.2 |
-0.4 |
-0.8 |
-1.1 |
|
1985 |
-1.1 |
-1.0 |
-0.9 |
-0.8 |
-0.7 |
-0.5 |
-0.4 |
-0.3 |
-0.2 |
-0.2 |
-0.2 |
-0.4 |
|
1986 |
-0.6 |
-0.7 |
-0.5 |
-0.3 |
-0.1 |
0.0 |
0.3 |
0.6 |
0.9 |
1.1 |
1.2 |
1.2 |
|
1987 |
1.2 |
1.2 |
1.1 |
1.0 |
1.1 |
1.3 |
1.6 |
1.7 |
1.8 |
1.7 |
1.4 |
1.1 |
|
1988 |
0.7 |
0.3 |
0.0 |
-0.5 |
-1.0 |
-1.4 |
-1.5 |
-1.4 |
-1.5 |
-1.7 |
-2.1 |
-2.1 |
|
1989 |
-1.9 |
-1.6 |
-1.3 |
-1.1 |
-0.8 |
-0.6 |
-0.5 |
-0.4 |
-0.4 |
-0.3 |
-0.3 |
-0.2 |
|
YR |
DJF |
JFM |
FMA |
MAM |
AMJ |
MJJ |
JJA |
JAS |
ASO |
SON |
OND |
NDJ |
|
1990 |
-0.1 |
0.0 |
0.1 |
0.2 |
0.2 |
0.1 |
0.1 |
0.2 |
0.3 |
0.3 |
0.2 |
0.3 |
|
1991 |
0.3 |
0.2 |
0.1 |
0.3 |
0.5 |
0.6 |
0.7 |
0.6 |
0.8 |
0.9 |
1.3 |
1.5 |
|
1992 |
1.6 |
1.6 |
1.4 |
1.2 |
1.0 |
0.7 |
0.3 |
0.1 |
-0.1 |
-0.1 |
-0.1 |
0.1 |
|
1993 |
0.2 |
0.3 |
0.4 |
0.6 |
0.7 |
0.5 |
0.3 |
0.3 |
0.3 |
0.4 |
0.4 |
0.2 |
|
1994 |
0.1 |
0.0 |
0.0 |
0.1 |
0.2 |
0.2 |
0.3 |
0.3 |
0.7 |
0.9 |
1.2 |
1.2 |
|
1995 |
1.0 |
0.7 |
0.4 |
0.1 |
0.0 |
-0.2 |
-0.3 |
-0.4 |
-0.6 |
-0.7 |
-0.8 |
-0.9 |
|
1996 |
-0.9 |
-0.7 |
-0.6 |
-0.5 |
-0.4 |
-0.4 |
-0.3 |
-0.3 |
-0.2 |
-0.2 |
-0.4 |
-0.5 |
|
1997 |
-0.5 |
-0.4 |
-0.1 |
0.2 |
0.7 |
1.1 |
1.6 |
1.9 |
2.3 |
2.5 |
2.6 |
2.7 |
|
1998 |
2.5 |
2.2 |
1.6 |
1.1 |
0.3 |
-0.4 |
-1.1 |
-1.2 |
-1.2 |
-1.2 |
-1.4 |
-1.4 |
|
1999 |
-1.3 |
-1.1 |
-0.9 |
-0.8 |
-0.8 |
-0.9 |
-1.0 |
-1.0 |
-1.1 |
-1.1 |
-1.3 |
-1.5 |
|
DJF |
JFM |
FMA |
MAM |
AMJ |
MJJ |
JJA |
JAS |
ASO |
SON |
OND |
NDJ |
|
|
2000 |
-1.5 |
-1.3 |
-1.0 |
-0.8 |
-0.6 |
-0.6 |
-0.5 |
-0.5 |
-0.4 |
-0.6 |
-0.7 |
-0.7 |
|
2001 |
-0.6 |
-0.4 |
-0.3 |
-0.2 |
-0.1 |
0.0 |
0.0 |
0.0 |
-0.1 |
-0.1 |
-0.2 |
-0.1 |
|
2002 |
0.1 |
0.2 |
0.2 |
0.3 |
0.5 |
0.6 |
0.8 |
0.9 |
1.1 |
1.3 |
1.5 |
1.4 |
|
2003 |
1.1 |
0.8 |
0.4 |
-0.1 |
-0.4 |
-0.3 |
-0.1 |
0.1 |
0.2 |
0.3 |
0.3 |
0.3 |
|
2004 |
0.2 |
0.1 |
0.0 |
0.0 |
0.0 |
0.0 |
0.3 |
0.6 |
0.7 |
0.6 |
0.6 |
0.6 |
|
2005 |
0.5 |
0.4 |
0.2 |
0.2 |
0.1 |
0.1 |
0.1 |
0.0 |
-0.1 |
-0.2 |
-0.4 |
-0.7 |
|
2006 |
-0.8 |
-0.7 |
-0.6 |
-0.4 |
-0.2 |
-0.1 |
0.1 |
0.3 |
0.5 |
0.8 |
0.9 |
0.9 |
|
2007 |
0.6 |
0.2 |
-0.1 |
-0.3 |
-0.4 |
-0.5 |
-0.5 |
-0.7 |
-1.1 |
-1.4 |
-1.6 |
-1.6 |
|
2008 |
-1.7 |
-1.6 |
-1.4 |
-1.0 |
-0.9 |
-0.6 |
-0.3 |
-0.2 |
-0.3 |
-0.4 |
-0.6 |
-0.7 |
|
2009 |
-0.8 |
-0.7 |
-0.6 |
-0.3 |
0.0 |
0.3 |
0.5 |
0.6 |
0.7 |
1.0 |
1.3 |
1.5 |
|
YR |
DJF |
JFM |
FMA |
MAM |
AMJ |
MJJ |
JJA |
JAS |
ASO |
SON |
OND |
NDJ |
|
2010 |
1.4 |
1.2 |
0.9 |
0.4 |
-0.2 |
-0.7 |
-1.1 |
-1.3 |
-1.5 |
-1.6 |
-1.7 |
-1.6 |
|
2011 |
-1.5 |
-1.3 |
-1.0 |
-0.8 |
-0.6 |
-0.4 |
-0.5 |
-0.6 |
-0.8 |
-0.9 |
-1.0 |
-1.0 |
|
2012 |
-0.9 |
-0.7 |
-0.6 |
-0.4 |
-0.3 |
0.0 |
0.3 |
0.5 |
0.4 |
0.3 |
0.1 |
-0.1 |
|
2013 |
-0.3 |
-0.3 |
-0.2 |
-0.3 |
-0.3 |
-0.4 |
-0.4 |
-0.3 |
-0.3 |
-0.1 |
-0.2 |
-0.2 |
|
2014 |
-0.4 |
-0.4 |
-0.2 |
0.1 |
0.2 |
0.2 |
0.1 |
0.1 |
0.3 |
0.5 |
0.6 |
0.7 |
|
2015 |
0.6 |
0.5 |
0.5 |
0.7 |
0.8 |
1.0 |
1.4 |
1.7 |
2.0 |
2.3 |
2.5 |
2.6 |
|
2016 |
2.4 |
2.1 |
1.5 |
0.9 |
0.3 |
-0.1 |
-0.4 |
-0.5 |
-0.6 |
-0.7 |
-0.7 |
-0.5 |
|
2017 |
-0.3 |
-0.1 |
0.1 |
0.2 |
0.3 |
0.3 |
0.1 |
-0.1 |
-0.4 |
-0.6 |
-0.8 |
-0.9 |
|
2018 |
-0.9 |
-0.8 |
-0.7 |
-0.5 |
-0.3 |
-0.1 |
0.1 |
0.2 |
0.4 |
0.6 |
0.8 |
0.8 |
|
2019 |
0.7 |
0.7 |
0.7 |
0.7 |
0.5 |
0.4 |
0.3 |
0.2 |
0.2 |
0.3 |
0.5 |
0.5 |
|
YR |
DJF |
JFM |
FMA |
MAM |
AMJ |
MJJ |
JJA |
JAS |
ASO |
SON |
OND |
NDJ |
|
2020 |
0.4 |
0.4 |
0.3 |
0.1 |
-0.2 |
-0.4 |
-0.4 |
-0.6 |
-1.0 |
-1.2 |
-1.3 |
-1.2 |
|
2021 |
-1.0 |
-0.9 |
-0.7 |
-0.6 |
-0.5 |
-0.4 |
-0.4 |
-0.4 |
-0.7 |
-0.8 |
-1.0 |
-1.0 |
|
2022 |
-0.9 |
-0.9 |
-1.0 |
-1.1 |
-1.1 |
-0.9 |
-0.9 |
-0.9 |
-1.0 |
-1.0 |
-1.0 |
-0.9 |
|
2023 |
-0.8 |
-0.5 |
-0.2 |
0.1 |
0.4 |
0.7 |
1.0 |
1.3 |
1.4 |
1.6 |
1.7 |
1.8 |
|
2024 |
1.7 |
- |
- |
- |
- |
- |
- |
- |
- |
- |
- |
- |
Tables 6-9. ENS ONI Index rounded to the nearest 0.1°C (1850 - Feb 2024)
ACKNOWLEDGEMENTS
I want to provide a special thanks to my peers at UNC-Charlotte, my advisor Dr Brian Magi (@brianmagi), and Terrell Wade (@Thunderstorm381), and so many others for their support, advice, and providing me with the necessary tools and coding skill sets to conduct this project
References
Abhik, S., et al. (2019). "On the Sensitivity of Convectively Coupled Equatorial Waves to the Quasi-Biennial Oscillation." Journal of Climate 32(18): 5833-5847.
Allan, R. J., et al. (2002). "A reconstruction of Madras (Chennai) mean sea-level pressure using instrumental records from the late 18th and early 19th centuries." International Journal of Climatology 22(9): 1119-1142.
Allan, R.J., Nicholls, N., Jones, P.D. and Butterworth, I.J. (1991) A further extension of the Tahiti-Darwin SOI, early ENSO events and Darwin pressure. Journal of Climate, 4, 743– 749.
Amaya, D. J. and G. R. Foltz (2014). "Impacts of canonical and Modoki El Niño on tropical Atlantic SST." Journal of Geophysical Research: Oceans 119(2): 777-789.
An, S.-I. and F.-F. Jin (2004). "Nonlinearity and asymmetry of ENSO." Journal of Climate 17(12): 2399-2412.
An, S.-I. and Kim, J.-W. (2017) Role of nonlinear ocean dynamic response to wind on the asymmetrical transition of El Niño and La Niña. Geophysical Research Letters, 44, 393– 400.
An, S.-I. and Kim, J.-W. (2018) ENSO transition asymmetry: internal and external causes and intermodel diversity. Geophysical Research Letters, 45, 5095– 5104.
Anderson, D.M., Mauk, E.M., Wahl, E.R., Morrill, C., Wagner, A.J., Easterling, D. and Rutishauser, T.(2013) Global warming in an independent record of the past 130 years. Geophysical Research Letters, 40, 189– 193.
Ashok, K., Behera, S.K., Rao, S.A., Weng, H. and Yamagata, T. (2007) El Niño Modoki and its possible teleconnection. Journal of Geophysical Research: Oceans, 112, C11007.
Ault, T.R., Deser, C., Newman, M. and Emile-Geay, J. (2013) Characterizing decadal to centennial variability in the equatorial Pacific during the last millennium. Geophysical Research Letters, 40, 3450– 3456.
Australian Bureau of Meteorology. “About ENSO and IOD indices”. http://www.bom.gov.au/climate/enso/indices/about.shtml
Barnston, A.G., Chelliah, M. and Goldenberg, S.B. (1997) Documentation of a highly ENSO-related sst region in the equatorial Pacific: research note. Atmosphere-Ocean, 35, 367– 383.
Bing, Z. and S. Xie (2017). "The 2015/16 “Super” El Niño Event and Its Climatic Impact." Chinese Journal of Urban and Environmental Studies 05(03): 1750017.
Bjerknes, J. (1966) A possible response of the atmospheric Hadley circulation to equatorial anomalies of ocean temperature. Tellus, 18, 820– 829.
Bjerknes, J. (1969) Atmospheric teleconnections from the equatorial Pacific. Monthly Weather Review, 97, 163– 172.
Bove, M.C., Elsner, J.B., Landsea, C.W., Niu, X. and O'Brien, J.J. (1998) Effect of El Niño on US landfalling hurricanes, revisited. Bulletin of the American Meteorological Society, 79, 2477– 2482.
Braganza, K., Gergis, J.L., Power, S.B., Risbey, J.S. and Fowler, A.M. (2009) A multiproxy index of the El Niño–Southern Oscillation, A.D. 1525–1982. Journal of Geophysical Research: Atmospheres, 114, D05106.
Butler, A. H. and L. M. Polvani (2011). "El Niño, La Niña, and stratospheric sudden warmings: A reevaluation in light of the observational record." Geophysical Research Letters 38(13).
Cai, W., McPhaden, M.J., Grimm, A.M. et al. Climate impacts of the El Niño–Southern Oscillation on South America. Nat Rev Earth Environ 1, 215–231 (2020). https://doi.org/10.1038/s43017-020-0040-3
Callahan, C. W., et al. (2021). "Robust decrease in El Niño/Southern Oscillation amplitude under long-term warming." Nature Climate Change 11(9): 752-757.
Carella, G., Kennedy, J.J., Berry, D.I., Hirahara, S., Merchant, C.J., Morak-Bozzo, S. and Kent, E.C.(2018) Estimating sea surface temperature measurement methods using characteristic differences in the diurnal cycle. Geophysical Research Letters, 45, 363– 371.
Chen, D., Cane, M.A., Kaplan, A., Zebiak, S.E. and Huang, D. (2004) Predictability of El Niño over the past 148 years. Nature, 428, 733– 736.
Chen, L., et al. (2016). "Distinctive precursory air–sea signals between regular and super El Niños." Advances in Atmospheric Sciences 33(8): 996-1004.
Choi, K.-Y., Vecchi, G.A. and Wittenberg, A.T. (2013) ENSO transition, duration, and amplitude asymmetries: role of the nonlinear wind stress coupling in a conceptual model. Journal of Climate, 26, 9462– 9476.
Climate Prediction Center. (2005). El Nino Regions. Retrieved from: https://www.cpc.ncep.noaa.gov/products/analysis_monitoring/ensostuff/ninoareas_c.jpg
Coelho, C.A.S., Uvo, C.B. and Ambrizzi, T. (2002) Exploring the impacts of the tropical Pacific SST on the precipitation patterns over South America during ENSO periods. Theoretical and Applied Climatology, 71, 185– 197.
Compo, G. P., et al. (2011). "The Twentieth Century Reanalysis Project." Quarterly Journal of the Royal Meteorological Society 137(654): 1-28.
Cook, E., D'Arrigo, R. & Anchukaitis, K. (2008) ENSO reconstructions from long tree-ring chronologies: Unifying the differences. Talk presented at a special workshop on Reconciling ENSO Chronologies for the Past, 2008.
Cram, T.A., et al. (2015) The International Surface Pressure Databank version 2. Geoscience Data Journal, 2, 31– 46.
Dai, A. and Wigley, T.M.L. (2000) Global patterns of ENSO-induced precipitation. Geophysical Research Letters, 27, 1283– 1286.
Dätwyler, C., Grosjean, M., Steiger, N.J. and Neukom, R. (2020) Teleconnections and relationship between the El Niño–Southern Oscillation (ENSO) and the southern annular mode (SAM) in reconstructions and models over the past millennium. Climate of the Past, 16, 743– 756.
Dee, D. P., et al. (2011). "The ERA‐Interim reanalysis: Configuration and performance of the data assimilation system." Quarterly Journal of the Royal Meteorological Society 137(656): 553-597.
Deser, C. and Wallace, J.M. (1987) El Niño events and their relation to the Southern Oscillation: 1925–1986. Journal of Geophysical Research: Oceans, 92, 14189– 14196.
DiNezio, P. N. and C. Deser (2014). "Nonlinear Controls on the Persistence of La Niña*." Journal of Climate 27(19): 7335-7355.
Douglas Schuster, N. (2010). Content, discovery, and accessibility enhancements to the NCAR Research Data Archive. 26th Conference on Interactive Information and Processing Systems.
Enfield, D.B. (1989) El Niño, past and present. Reviews of Geophysics, 27, 159– 187.
Enfield, D.B. and Cid, S.L. (1991) Low-frequency changes in El Niño–Southern Oscillation. Journal of Climate, 4, 1137– 1146.
Folland, C.K., Parker, D.E. and Kates, F.E. (1984) Worldwide marine temperature fluctuations 1856–1981. Nature, 310, 670– 673.
Folland, C. K. and D. E. Parker (1995). "Correction of instrumental biases in historical sea surface temperature data." Quarterly Journal of the Royal Meteorological Society 121(522): 319-367.
Fredriksen, H.-B., Berner, J., Subramanian, A.C. and Capotondi, A. (2020) How does El Niño–Southern Oscillation change under global warming—a first look at CMIP6. Geophysical Research Letters, 47, e2020GL090640.
Freeman, E., et al. (2017). "ICOADS Release 3.0: a major update to the historical marine climate record." International Journal of Climatology 37(5): 2211-2232.
Freund, M.B., Henley, B.J., Karoly, D.J., McGregor, H.V., Abram, N.J. and Dommenget, D. (2019) Higher frequency of central Pacific El Niño events in recent decades relative to past centuries. Nature Geoscience, 12, 450– 455.
Garcia-Herrera, R., et al. (2008). "A Chronology of El Niño Events from Primary Documentary Sources in Northern Peru*." Journal of Climate 21(9): 1948-1962.
Garfinkel, C. I., et al. (2019). "The salience of nonlinearities in the boreal winter response to ENSO: North Pacific and North America." Climate Dynamics 52(7): 4429-4446.
Gelaro, R., et al. (2017). "The Modern-Era Retrospective Analysis for Research and Applications, Version 2 (MERRA-2)." Journal of Climate 30(14): 5419-5454.
Gergis, J.L. and Fowler, A.M. (2005) Classification of synchronous oceanic and atmospheric El Niño–Southern Oscillation (ENSO) events for palaeoclimate reconstruction. International Journal of Climatology, 25, 1541– 1565.
Gergis, J.L. and Fowler, A.M. (2009) A history of ENSO events since A.D. 1525: implications for future climate change. Climatic Change, 92, 343– 387.
Giese, B.S., Compo, G.P., Slowey, N.C., Sardeshmukh, P.D., Carton, J.A., Ray, S. and Whitaker, J.S.(2010) The 1918/19 El Niño. Bulletin of the American Meteorological Society, 91, 177– 183.
Giese, B.S. and Ray, S. (2011) El Niño variability in simple ocean data assimilation (SODA), 1871–2008. Journal of Geophysical Research: Oceans, 116, C02024.
Giese, B.S., Seidel, H.F., Compo, G.P. and Sardeshmukh, P.D. (2016) An ensemble of ocean reanalyses for 1815–2013 with sparse observational input. Journal of Geophysical Research: Oceans, 121, 6891– 6910.
Glantz, M. H. and I. J. Ramirez (2020). "Reviewing the Oceanic Niño Index (ONI) to enhance societal readiness for El Niño’s impacts." International Journal of Disaster Risk Science 11(3): 394-403.
Global Climate Observing System (GCOS) Working Group on Surface Pressure (WG-SP). (2018). www.esrl.noaa.gov/psd/gcos_wgsp/
Goddard, L. and M. Dilley (2005). "El Niño: catastrophe or opportunity." Journal of Climate 18(5): 651-665.
Guilyardi, E. (2006). "El Niño–mean state–seasonal cycle interactions in a multi-model ensemble." Climate Dynamics 26(4): 329-348.
Hakim, G.J., Emile-Geay, J., Steig, E.J., Noone, D., Anderson, D.M., Tardif, R., Steiger, N. and Perkins, W.A. (2016) The last millennium climate reanalysis project: framework and first results. Journal of Geophysical Research: Atmospheres, 121, 6745– 6764.
Ham, Y.-G. and J.-S. Kug (2012). "How well do current climate models simulate two types of El Niño?" Climate Dynamics 39(1): 383-398.
Hameed, S. N., et al. (2018). "A model for super El Niños." Nature Communications 9(1): 2528.
Hanley, D.E., Bourassa, M.A., O'Brien, J.J., Smith, S.R. and Spade, E.R. (2003) A quantitative evaluation of ENSO indices. Journal of Climate, 16, 1249– 1258.
Hausfather, Z., Cowtan, K., Clarke, D.C., Jacobs, P., Richardson, M. and Rohde, R. (2017) Assessing recent warming using instrumentally homogeneous sea surface temperature records. Science Advances, 3, e1601207.
Hayashi, M. and F. F. Jin (2017). "Subsurface nonlinear dynamical heating and ENSO asymmetry." Geophysical Research Letters 44(24): 12,427-412,435.
Hendon, H.H., Lim, E., Wang, G., Alves, O. and Hudson, D. (2009) Prospects for predicting two flavors of El Niño. Geophysical Research Letters, 36, L19713.
Hennermann, K. and Berrisford, P.: What are the changes from ERA-Interim to ERA5? (2018). https://confluence.ecmwf.int/pages/viewpage.action?pageId=74764925
Hersbach, H., et al. (2020) The ERA5 global reanalysis. Quarterly Journal of the Royal Meteorological Society, 146, 1999– 2049.
Hersbach, H., et al. (2015). "ERA-20CM: a twentieth-century atmospheric model ensemble." Quarterly Journal of the Royal Meteorological Society 141(691): 2350-2375.
Hirahara, S., et al. (2014). "Centennial-Scale Sea Surface Temperature Analysis and Its Uncertainty." Journal of Climate 27(1): 57-75.
Hong, L.-C. (2016). Super El Niño, Springer.
Hu, Z.-Z., et al. (2014). "Why were some La Niñas followed by another La Niña?" Climate Dynamics 42(3): 1029-1042.
Huang, B., et al. (2015). "Extended Reconstructed Sea Surface Temperature Version 4 (ERSST.v4). Part I: Upgrades and Intercomparisons." Journal of Climate 28(3): 911-930.
Huang, B., et al. (2016). "Further Exploring and Quantifying Uncertainties for Extended Reconstructed Sea Surface Temperature (ERSST) Version 4 (v4)." Journal of Climate 29(9): 3119-3142.
Huang, B., et al. (2016). "Ranking the strongest ENSO events while incorporating SST uncertainty." Geophysical Research Letters 43(17): 9165-9172.
Huang, B., et al. (2017). "Extended reconstructed sea surface temperature, version 5 (ERSSTv5): upgrades, validations, and intercomparisons." Journal of Climate 30(20): 8179-8205.
Huang, B., et al. (2020). "How Significant Was the 1877/78 El Niño?" Journal of Climate 33(11): 4853-4869.
Hurwitz, M., et al. (2011). "Response of the Antarctic stratosphere to two types of El Niño events." Journal of the Atmospheric Sciences 68(4): 812-822.
Ishii, M., et al. (2005). "Objective analyses of sea-surface temperature and marine meteorological variables for the 20th century using ICOADS and the Kobe Collection." International Journal of Climatology 25(7): 865-879.
Japan Meteorological Agency. "El Nino Monitoring and Outlook" ds.data.jma.go.jp/tcc/tcc/products/elnino/elmonout.html
Jiang, W., Huang, P., Huang, G. and Ying, J. (2021) Origins of the excessive westward extension of ENSO SST simulated in CMIP5 and CMIP6 models. Journal of Climate, 34, 2839– 2851.
Kalnay, E., et al. (1996) The NCEP/NCAR 40-year reanalysis project. Bulletin of the American Meteorological Society, 77, 437– 472.
Kanamitsu, M., et al. (2002). "Ncep–doe amip-ii reanalysis (r-2)." Bulletin of the American Meteorological Society 83(11): 1631-1644.
Kao, H.-Y. and Yu, J.-Y. (2009) Contrasting eastern-Pacific and central-Pacific types of ENSO. Journal of Climate, 22, 615– 632.
Kaplan, A., et al. (1998). "Analyses of global sea surface temperature 1856–1991." Journal of Geophysical Research: Oceans 103(C9): 18567-18589.
Karl, T.R., Arguez, A., Huang, B., Lawrimore, J.H., McMahon, J.R., Menne, M.J., Peterson, T.C., Vose, R.S. and Zhang, H.-M. (2015) Possible artifacts of data biases in the recent global surface warming hiatus. Science, 348, 1469– 1472.
Karnauskas, K. B., et al. (2012). "A Pacific Centennial Oscillation Predicted by Coupled GCMs*." Journal of Climate 25(17): 5943-5961.
Keeley, S. (2018). “ECMWF Climate Reanalysis” www.ecmwf.int/en/research/climate-reanalysis.
Kennedy, J. J., et al. (2011). "Reassessing biases and other uncertainties in sea surface temperature observations measured in situ since 1850: 1. Measurement and sampling uncertainties." Journal of Geophysical Research: Atmospheres 116(D14).
Kennedy, J. J. (2014). "A review of uncertainty in in situ measurements and data sets of sea surface temperature." Reviews of Geophysics 52(1): 1-32.
Kennedy, J. J., et al. (2019). "An ensemble data set of sea-surface temperature change from 1850: the Met Office Hadley Centre HadSST.4.0.0.0 data set." Journal of Geophysical Research: Atmospheres 0(ja).
Kent, E. C., et al. (2013). "Global analysis of night marine air temperature and its uncertainty since 1880: The HadNMAT2 data set." Journal of Geophysical Research: Atmospheres 118(3): 1281-1298.
Kent, E.C., et al. (2017) A call for new approaches to quantifying biases in observations of sea surface temperature. Bulletin of the American Meteorological Society, 98, 1601– 1616.
Kessler, W. S. (2002). "Is ENSO a cycle or a series of events?" Geophysical Research Letters 29(23): 40-41-40-44.
Khodri, M., et al. (2017). "Tropical explosive volcanic eruptions can trigger El Niño by cooling tropical Africa." Nature Communications 8(1): 1-13.
Kiladis, G. N. and H. F. Diaz (1986). "An Analysis of the 1877–78 ENSO Episode and Comparison with 1982–83." Monthly Weather Review 114(6): 1035-1047.
Ku, H. H. (1966). "Notes on the use of propagation of error formulas." Journal of Research of the National Bureau of Standards 70(4): 263-273.
Kug, J.-S., et al. (2009). "Two types of El Niño events: cold tongue El Niño and warm pool El Niño." Journal of Climate 22(6): 1499-1515.
L'Heureux, M.L., et al. (2017) Observing and predicting the 2015/16 El Niño. Bulletin of the American Meteorological Society, 98, 1363– 1382.
Laloyaux, P., et al. (2018). "CERA-20C: A Coupled Reanalysis of the Twentieth Century." Journal of Advances in Modeling Earth Systems 10(5): 1172-1195.
Langton, S.J., et al. (2008) 3500 yr record of centennial-scale climate variability from the Western Pacific Warm Pool. Geology, 36, 795– 798.
Latif, M., et al. (2015). "Super El Niños in response to global warming in a climate model." Climatic Change 132(4): 489-500.
Lemmon, D. E. and K. B. Karnauskas (2019). "A metric for quantifying El Niño pattern diversity with implications for ENSO–mean state interaction." Climate Dynamics 52(12): 7511-7523.
Levine, A.F.Z. and McPhaden, M.J. (2016) How the July 2014 easterly wind burst gave the 2015–2016 El Niño a head start. Geophysical Research Letters, 43, 6503– 6510.
Lewis, S.C. and LeGrande, A.N. (2015) Stability of ENSO and its tropical Pacific teleconnections over the Last Millennium. Climate of the Past, 11, 1347– 1360.
Li, J., et al. (2011) Interdecadal modulation of El Niño amplitude during the past millennium. Nature Climate Change, 1, 114– 118.
Lin, K. H. E., et al. (2020). "Historical droughts in the Qing dynasty (1644–1911) of China." Clim. Past 16(3): 911-931.
Liu, W., et al. (2015). "Extended Reconstructed Sea Surface Temperature Version 4 (ERSST.v4): Part II. Parametric and Structural Uncertainty Estimations." Journal of Climate 28(3): 931-951.
Liu, Y., et al. (2017) Recent enhancement of central Pacific El Niño variability relative to last eight centuries. Nature Communications, 8, 15386.
Luan, Y., et al. (2012) Early and mid-Holocene climate in the tropical Pacific: seasonal cycle and interannual variability induced by insolation changes. Climate of the Past, 8, 1093– 1108.
Lucena, D.B., et al. (2011) Rainfall response in Northeast Brazil from ocean climate variability during the second half of the twentieth century. Journal of Climate, 24, 6174– 6184.
McGregor, S., et al. (2013) Inferred changes in El Niño–Southern Oscillation variance over the past six centuries. Climate of the Past, 9, 2269– 2284.
McGregor, S., et al. (2010) A unified proxy for ENSO and PDO variability since 1650. Climate of the Past, 6, 1– 17.
McPhaden, M.J. (1999) Genesis and evolution of the 1997–98 El Niño. Science, 283, 950– 954.
McPhaden, M.J., et al. (2020) El Niño Southern Oscillation in a Changing Climate. Hoboken, NJ: John Wiley & Sons.
McPhaden, M.J., et al. (2015) The curious case of the EL Niño that never happened: a perspective from 40 years of progress in climate research and forecasting. Bulletin of the American Meteorological Society, 96, 1647– 1665.
Meehl, G.A., et al. (2006) Future changes of El Niño in two global coupled climate models. Climate Dynamics, 26, 549– 566.
Morice, C.P., et al. (2021) An updated assessment of near-surface temperature change from 1850: the HadCRUT5 data set. Journal of Geophysical Research: Atmospheres, 126, e2019JD032361.
NASA. (2018). “NASA Earth Observations” neo.sci.gsfc.nasa.gov/view.php?datasetId=MYD28M.
Neelin, J.D., et al (1998) ENSO theory. Journal of Geophysical Research: Oceans, 103, 14261– 14290.
Nguyen, P. L., et al. (2021). "Combined impacts of the El Niño‐Southern Oscillation and Pacific decadal oscillation on global droughts assessed using the standardized precipitation evapotranspiration index." International Journal of Climatology 41: E1645-E1662.
Null, J. (2018) “El Nino and La Nina Years and Intensities”. ggweather.com/enso/oni.htm
NOAA’s Climate Prediction Center. “Cold and Warm Episodes by Season”. origin.cpc.ncep.noaa.gov/products/analysis_monitoring/ensostuff/ONI_v5.php
NOAA’s Earth System Research Laboratory. (2020). https://esrl.noaa.gov/gmd/
NOAA’s National Centers for Environmental Information. (2018). “Equatorial Pacific Sea Surface Temperatures” www.ncdc.noaa.gov/teleconnections/enso/indicators/sst/
O'Carroll, A.G., et al. (2019) Observational needs of sea surface temperature. Frontiers in Marine Science, 6, 420.
Ohba, M. and Ueda, H. (2009) Role of nonlinear atmospheric response to SST on the asymmetric transition process of ENSO. Journal of Climate, 22, 177– 192.
Ohba, M. and Watanabe, M. (2012) Role of the Indo-Pacific Interbasin coupling in predicting asymmetric ENSO transition and duration. Journal of Climate, 25, 3321– 3335.
Okumura, Y.M. and Deser, C. (2010) Asymmetry in the duration of El Niño and La Niña. Journal of Climate, 23, 5826– 5843.
Okumura, Y. M., et al. (2011). "A proposed mechanism for the asymmetric duration of El Niño and La Niña." Journal of Climate 24(15): 3822-3829.
Ortlieb, L. (2000). The Documented Historical Record of El Nino Events in Peru: An Update of the Quinn Record (Sixteenth through Nineteenth Centuries): 207-295.
Parker, W. S. (2016). "Reanalyses and Observations: What’s the Difference?" Bulletin of the American Meteorological Society 97(9): 1565-1572.
Parkinson, C.L. (2003) Aqua: an earth-observing satellite mission to examine water and other climate variables. IEEE Transactions on Geoscience and Remote Sensing, 41, 173– 183.
Philander, S. (1990) El Niño, La Niña, and the Southern Oscillation. S. George Philander. Academic press, San Diego, CA, 1989. x, 293 pp., illus. $59.50. International geophysics series, vol. 46. Science, 248, 904– 905.
Phillips, J., Rajagopalan, B., Cane, M. and Rosenzweig, C. (1999) The role of ENSO in determining climate and maize yield variability in the U.S. cornbelt. International Journal of Climatology, 19, 877– 888.
Pillar, H.R., Johnson, H.L., Marshall, D.P., Heimbach, P. and Takao, S. (2018) Impacts of atmospheric reanalysis uncertainty on Atlantic overturning estimates at 25°N. Journal of Climate, 31, 8719– 8744.
Poli, P., et al. (2016). "ERA-20C: An Atmospheric Reanalysis of the Twentieth Century." Journal of Climate 29(11): 4083-4097.
Predybaylo, E., et al. (2017) Impacts of a Pinatubo-size volcanic eruption on ENSO. Journal of Geophysical Research: Atmospheres, 122, 925– 947.
Qian, C., et al. (2011) On changing El Niño: a view from time-varying annual cycle, interannual variability, and mean state. Journal of Climate, 24, 6486– 6500.
Quinn, W.H. (1993) The large-scale ENSO event, the El Niño and other important regional features. Bulletin de l'Institut Français d'Etudes Andines, 22, 13– 34.
Quinn, W. H., et al. (1987). "El Niño occurrences over the past four and a half centuries." Journal of Geophysical Research: Oceans 92(C13): 14449-14461.
Quinn, W.H., et al. (1978) Historical trends and statistics of the Southern Oscillation, El Niño, and Indonesian droughts. Fishery Bulletin, 76, 663– 678.
Ramesh, N. and Murtugudde, R. (2013) All flavours of El Niño have similar early subsurface origins. Nature Climate Change, 3, 42– 46.
Ray, S. and Giese, B.S. (2012) Historical changes in El Niño and La Niña characteristics in an ocean reanalysis. Journal of Geophysical Research, 117, C11007.
Rayner, N. A., et al. (2006). "Improved analyses of changes and uncertainties in sea surface temperature measured in situ since the mid-nineteenth century: The HadSST2 dataset." Journal of Climate 19(3): 446-469.
Rayner, N.A., et al. (2003) Global analyses of sea surface temperature, sea ice, and night marine air temperature since the late nineteenth century. Journal of Geophysical Research: Atmospheres, 108, 4407.
Ren, H. L. and F. F. Jin (2011). "Niño indices for two types of ENSO." Geophysical Research Letters 38(4).
Reynolds, R. W. (1988). "A Real-Time Global Sea Surface Temperature Analysis." Journal of Climate 1(1): 75-87.
Reynolds, R. W. and T. M. Smith (1994). "Improved Global Sea Surface Temperature Analyses Using Optimum Interpolation." Journal of Climate 7(6): 929-948.
Reynolds, R. W., et al. (2002). "An Improved In Situ and Satellite SST Analysis for Climate." Journal of Climate 15(13): 1609-1625.
Rienecker, M.M., et al. (2011) MERRA: NASA's modern-era retrospective analysis for research and applications. Journal of Climate, 24, 3624– 3648.
Rimbu, N., et al. (2004). "Impacts of the North Atlantic Oscillation and the El Nino–Southern Oscillation on Danube river flow variability." Geophysical Research Letters 31(23).
Ropelewski, C.F. and Jones, P.D. (1987) An extension of the Tahiti–Darwin southern oscillation index. Monthly Weather Review, 115, 2161– 2165.
Roundy, P. E., et al. (2010). "Modulation of the global atmospheric circulation by combined activity in the Madden–Julian oscillation and the El Niño–Southern Oscillation during boreal winter." Journal of Climate 23(15): 4045-4059.
Saha, S., et al. (2010). "The NCEP climate forecast system reanalysis." Bulletin of the American Meteorological Society 91(8): 1015-1058.
Sanabria, Janeet Margarita. "Interannual variability of the rainfall regime and strong ENSO events along the Peruvian Pacific Basin: large-scale control mechanisms. Meteorology". Université Paul Sabatier - Toulouse III, 2018. English. NNT : 2018TOU30143 . tel-02301101
Sanchez, S.C., et al. (2020) A continuous record of central tropical Pacific climate since the midnineteenth century reconstructed from fanning and Palmyra Island corals: a case study in coral data reanalysis. Paleoceanography and Paleoclimatology, 35, e2020PA003848.
Santoso, A., et al. (2017) The defining characteristics of ENSO extremes and the strong 2015/2016 El Niño. Reviews of Geophysics, 55, 1079– 1129.
Sardeshmukh, P. D., et al. (2000). "Changes of probability associated with El Niño." Journal of Climate 13(24): 4268-4286.
Shrestha, A. and R. Kostaschuk (2005). "El Nino/Southern Oscillation (ENSO)-related variablity in mean-monthly streamflow in Nepal." Journal of Hydrology 308(1-4): 33-49.
Shukla, R. P., et al. (2011). "Prediction of Indian summer monsoon rainfall using Niño indices: a neural network approach." Atmospheric Research 102(1-2): 99-109.
Singh, D., et al. (2018) Climate and the global famine of 1876–78. Journal of Climate, 31, 9445– 9467.
Slingo, J.M. and Annamalai, H. (2000) 1997: the El Niño of the century and the response of the Indian summer monsoon. Monthly Weather Review, 128, 1778– 1797.
Slivinski, L. C., et al. (2019). "Towards a more reliable historical reanalysis: Improvements for version 3 of the Twentieth Century Reanalysis system." Quarterly Journal of the Royal Meteorological Society 145(724): 2876-2908.
Smith, C. A. and P. D. Sardeshmukh (2000). "The effect of ENSO on the intraseasonal variance of surface temperatures in winter." International Journal of Climatology 20(13): 1543-1557.
Smith, T. M., et al. (2008). "Improvements to NOAA’s historical merged land–ocean surface temperature analysis (1880–2006)." Journal of Climate 21(10): 2283-2296.
Song, et al. (2016) A classified El Niño index using AVHRR remote-sensing SST data. International Journal of Remote Sensing, 37, 403– 417.
Stahle, D.W., et al. (1998) Experimental dendroclimatic reconstruction of the Southern Oscillation. Bulletin of the American Meteorological Society, 79, 2137– 2152.
Sullivan, A., et al. (2016) Robust contribution of decadal anomalies to the frequency of central-Pacific El Niño. Scientific Reports, 6, 38540.
Takahashi, K., et al. (2014) El índice costero El Niño (ICEN): historia y actualización. Boletin Tecnico, 1, 8– 9.
Tardif, R., et al. (2019) Last Millennium Reanalysis with an expanded proxy database and seasonal proxy modeling. Climate of the Past, 15, 1251– 1273.
Thompson, D.W.J., et al. (2008) A large discontinuity in the mid-twentieth century in observed global-mean surface temperature. Nature, 453, 646– 649.
Thorne, P.W., et al. (2005) Uncertainties in climate trends: lessons from upper-air temperature records. Bulletin of the American Meteorological Society, 86, 1437– 1442.
Tian, Z., et al. (2017) Causes of ENSO weakening during the mid-Holocene. Journal of Climate, 30, 7049– 7070.
Tindall, J.C., et al. (2016) Accounting for centennial-scale variability when detecting changes in ENSO: a study of the Pliocene. Paleoceanography, 31, 1330– 1349.
Titchner, H. A. and N. A. Rayner (2014). "The Met Office Hadley Centre sea ice and sea surface temperature data set, version 2: 1. Sea ice concentrations." Journal of Geophysical Research: Atmospheres 119(6): 2864-2889.
Trenberth, K.E. (1997) The definition of El Niño. Bulletin of the American Meteorological Society, 78, 2771– 2778.
Trenberth, K. E. and T. J. Hoar (1997). "El Niño and climate change." Geophysical Research Letters 24(23): 3057-3060.
Trouet, V. and G. J. Van Oldenborgh (2013). "KNMI Climate Explorer: a web-based research tool for high-resolution paleoclimatology." Tree-Ring Research 69(1): 3-13.
Troup, A.J. (1965) The “southern oscillation”. Quarterly Journal of the Royal Meteorological Society, 91, 490– 506.
Tsonis, A. A. and K. L. Swanson (2008). "Topology and predictability of El Nino and La Nina networks." Physical Review Letters 100(22): 228502.
Turkington, T., et al. (2019) The impact of global warming on sea surface temperature based El Niño–Southern Oscillation monitoring indices. International Journal of Climatology, 39, 1092– 1103.
Ummenhofer, C.C., et al. (2011) Multi-decadal modulation of the El Niño–Indian monsoon relationship by Indian Ocean variability. Environmental Research Letters, 6, 034006.
van der Werf, G.R., et al. (2004) Continental-scale partitioning of fire emissions during the 1997–2001 El Niño/La Niña period. Science, 303, 73– 76.
van Oldenborgh, G.J., et al. (2021) Defining El Niño indices in a warming climate. Environmental Research Letters, 16, 044003.
van Oldenborgh, G., KNMI Climate Explorer. Retrieved from: https://climexp.knmi.nl/about.cgi?id=someone@somewhere
Voskresenskaya, E.N. and Marchukova, O.V. (2017) Spatial classification of La Niña events. Izvestiya, Atmospheric and Oceanic Physics, 53, 111– 119.
Wallace, J.M. and Gutzler, D.S. (1981) Teleconnections in the geopotential height field during the Northern Hemisphere winter. Monthly Weather Review, 109, 784– 812.
Wang, B., et al. (2019) Historical change of El Niño properties sheds light on future changes of extreme El Niño. Proceedings of the National Academy of Sciences of the United States of America, 116, 22512– 22517.
Wang, Y., et al. (2001). "Impact of the preceding El Niño on the East Asian summer atmosphere circulation." Journal of the Meteorological Society of Japan. Ser. II 79(1B): 575-588.
Wang, B., et al. (2000) Pacific–East Asian teleconnection: How does ENSO affect East Asian climate? Journal of Climate, 13, 1517– 1536.
Wang, Z., et al. (2021) Evaluation of the performance of CMIP5 and CMIP6 models in simulating the South Pacific quadrupole–ENSO relationship. Atmospheric and Oceanic Science Letters, 14, 100057.
Webb, E. J. (2017). “A Reanalysis of the Extended Multivariate ENSO Index (MEI.ext) and Comparison of the 1877-78 and 2015-16 El Nino Events". 97th Annual AMS Conference.
ams.confex.com/ams/97Annual/webprogram/Paper317006.html
Webb, E. J. (2020). “Reanalysis of the Extended Multivariate ENSO Index”. 100th Annual AMS Conference
ams.confex.com/ams/2020Annual/webprogram/Paper369557.html
Webb, E. J. and B. I. Magi "The Ensemble Oceanic Niño Index." International Journal of Climatology n/a(n/a) (pages still being enumerated).
Wilson, R., et al. (2010) Reconstructing ENSO: the influence of method, proxy data, climate forcing and teleconnections. Journal of Quaternary Science, 25, 62– 78.
Wittenberg, A.T. (2009) Are historical records sufficient to constrain ENSO simulations? Geophysical Research Letters, 36, L12702.
Wolde-Georgis, T. (1997) El Niño and drought early warning in Ethiopia. Internet Journal of African Studies, 1997, 2.
Wolter, K. and M. S. Timlin (1993). Monitoring ENSO in COADS with a seasonally adjusted principal component index.
Wolter, K. and M. S. Timlin (1998). "Measuring the strength of ENSO events: How does 1997/98 rank?" Weather 53(9): 315-324.
Wolter, K. and M. S. Timlin (2011). "El Niño/Southern Oscillation behaviour since 1871 as diagnosed in an extended multivariate ENSO index (MEI.ext)." International Journal of Climatology 31(7): 1074-1087.
Woodruff, S.D., et al. (2011) ICOADS release 2.5: extensions and enhancements to the surface marine meteorological archive. International Journal of Climatology, 31, 951– 967.
Wu, X., et al. (2019). "What Controls the Duration of El Niño and La Niña Events?" Journal of Climate 32(18): 5941-5965.
Xie, S.-P., et al. (2009) Indian Ocean capacitor effect on Indo–Western Pacific climate during the summer following El Niño. Journal of Climate, 22, 730– 747.
Xie, R. and F.-F. Jin (2018). "Two leading ENSO modes and El Niño types in the Zebiak–Cane model." Journal of Climate 31(5): 1943-1962.
Yeh, S.-W., et al. (2012) Changes in the tropical Pacific SST trend from CMIP3 to CMIP5 and its implication of ENSO. Journal of Climate, 25, 7764– 7771.
Yeh, S.-W., et al. (2009) El Niño in a changing climate. Nature, 461, 511– 514.
Yu, J.-Y., et al. (2011) Subsurface ocean temperature indices for central-Pacific and eastern-Pacific types of El Niño and La Niña events. Theoretical and Applied Climatology, 103, 337– 344.
Yu, L., et al. (2008). 2008: Multidecade global flux datasets from the Objectively Analyzed Air-Sea Fluxes (OAFlux) Project: Latent and sensible heat fluxes, ocean evaporation, and related surface meteorological variables. Woods Hole Oceanographic Institution OAFlux Project Tec. Rep, Citeseer.
Yuan, Y. and S. Yang (2012). "Impacts of different types of El Niño on the East Asian climate: Focus on ENSO cycles." Journal of Climate 25(21): 7702-7722.
Zanchettin, D., et al. (2008) On ENSO impacts on European wintertime rainfalls and their modulation by the NAO and the Pacific multi-decadal variability described through the PDO index. International Journal of Climatology, 28, 995– 1006.
Zhang, W., et al. (2015) Impact of different El Niño types on the El Niño/IOD relationship. Geophysical Research Letters, 42, 8570– 8576.
Zhu, J., et al. (2012) Ensemble ENSO hindcasts initialized from multiple ocean analyses. Geophysical Research Letters, 39, L09602.
Zhu, J., et al. (2018). "Response of tropical terrestrial gross primary production to the super El Niño event in 2015." Journal of Geophysical Research: Biogeosciences 123(10): 3193-3203.
Zuo, H., et al. (2019). "The ECMWF operational ensemble reanalysis–analysis system for ocean and sea ice: a description of the system and assessment." Ocean Sci. 15(3): 779-808.
Allan, R. J., et al. (2002). "A reconstruction of Madras (Chennai) mean sea-level pressure using instrumental records from the late 18th and early 19th centuries." International Journal of Climatology 22(9): 1119-1142.
Allan, R.J., Nicholls, N., Jones, P.D. and Butterworth, I.J. (1991) A further extension of the Tahiti-Darwin SOI, early ENSO events and Darwin pressure. Journal of Climate, 4, 743– 749.
Amaya, D. J. and G. R. Foltz (2014). "Impacts of canonical and Modoki El Niño on tropical Atlantic SST." Journal of Geophysical Research: Oceans 119(2): 777-789.
An, S.-I. and F.-F. Jin (2004). "Nonlinearity and asymmetry of ENSO." Journal of Climate 17(12): 2399-2412.
An, S.-I. and Kim, J.-W. (2017) Role of nonlinear ocean dynamic response to wind on the asymmetrical transition of El Niño and La Niña. Geophysical Research Letters, 44, 393– 400.
An, S.-I. and Kim, J.-W. (2018) ENSO transition asymmetry: internal and external causes and intermodel diversity. Geophysical Research Letters, 45, 5095– 5104.
Anderson, D.M., Mauk, E.M., Wahl, E.R., Morrill, C., Wagner, A.J., Easterling, D. and Rutishauser, T.(2013) Global warming in an independent record of the past 130 years. Geophysical Research Letters, 40, 189– 193.
Ashok, K., Behera, S.K., Rao, S.A., Weng, H. and Yamagata, T. (2007) El Niño Modoki and its possible teleconnection. Journal of Geophysical Research: Oceans, 112, C11007.
Ault, T.R., Deser, C., Newman, M. and Emile-Geay, J. (2013) Characterizing decadal to centennial variability in the equatorial Pacific during the last millennium. Geophysical Research Letters, 40, 3450– 3456.
Australian Bureau of Meteorology. “About ENSO and IOD indices”. http://www.bom.gov.au/climate/enso/indices/about.shtml
Barnston, A.G., Chelliah, M. and Goldenberg, S.B. (1997) Documentation of a highly ENSO-related sst region in the equatorial Pacific: research note. Atmosphere-Ocean, 35, 367– 383.
Bing, Z. and S. Xie (2017). "The 2015/16 “Super” El Niño Event and Its Climatic Impact." Chinese Journal of Urban and Environmental Studies 05(03): 1750017.
Bjerknes, J. (1966) A possible response of the atmospheric Hadley circulation to equatorial anomalies of ocean temperature. Tellus, 18, 820– 829.
Bjerknes, J. (1969) Atmospheric teleconnections from the equatorial Pacific. Monthly Weather Review, 97, 163– 172.
Bove, M.C., Elsner, J.B., Landsea, C.W., Niu, X. and O'Brien, J.J. (1998) Effect of El Niño on US landfalling hurricanes, revisited. Bulletin of the American Meteorological Society, 79, 2477– 2482.
Braganza, K., Gergis, J.L., Power, S.B., Risbey, J.S. and Fowler, A.M. (2009) A multiproxy index of the El Niño–Southern Oscillation, A.D. 1525–1982. Journal of Geophysical Research: Atmospheres, 114, D05106.
Butler, A. H. and L. M. Polvani (2011). "El Niño, La Niña, and stratospheric sudden warmings: A reevaluation in light of the observational record." Geophysical Research Letters 38(13).
Cai, W., McPhaden, M.J., Grimm, A.M. et al. Climate impacts of the El Niño–Southern Oscillation on South America. Nat Rev Earth Environ 1, 215–231 (2020). https://doi.org/10.1038/s43017-020-0040-3
Callahan, C. W., et al. (2021). "Robust decrease in El Niño/Southern Oscillation amplitude under long-term warming." Nature Climate Change 11(9): 752-757.
Carella, G., Kennedy, J.J., Berry, D.I., Hirahara, S., Merchant, C.J., Morak-Bozzo, S. and Kent, E.C.(2018) Estimating sea surface temperature measurement methods using characteristic differences in the diurnal cycle. Geophysical Research Letters, 45, 363– 371.
Chen, D., Cane, M.A., Kaplan, A., Zebiak, S.E. and Huang, D. (2004) Predictability of El Niño over the past 148 years. Nature, 428, 733– 736.
Chen, L., et al. (2016). "Distinctive precursory air–sea signals between regular and super El Niños." Advances in Atmospheric Sciences 33(8): 996-1004.
Choi, K.-Y., Vecchi, G.A. and Wittenberg, A.T. (2013) ENSO transition, duration, and amplitude asymmetries: role of the nonlinear wind stress coupling in a conceptual model. Journal of Climate, 26, 9462– 9476.
Climate Prediction Center. (2005). El Nino Regions. Retrieved from: https://www.cpc.ncep.noaa.gov/products/analysis_monitoring/ensostuff/ninoareas_c.jpg
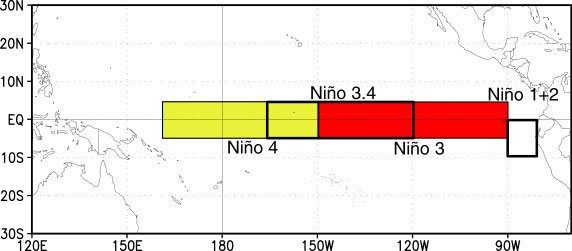
Coelho, C.A.S., Uvo, C.B. and Ambrizzi, T. (2002) Exploring the impacts of the tropical Pacific SST on the precipitation patterns over South America during ENSO periods. Theoretical and Applied Climatology, 71, 185– 197.
Compo, G. P., et al. (2011). "The Twentieth Century Reanalysis Project." Quarterly Journal of the Royal Meteorological Society 137(654): 1-28.
Cook, E., D'Arrigo, R. & Anchukaitis, K. (2008) ENSO reconstructions from long tree-ring chronologies: Unifying the differences. Talk presented at a special workshop on Reconciling ENSO Chronologies for the Past, 2008.
Cram, T.A., et al. (2015) The International Surface Pressure Databank version 2. Geoscience Data Journal, 2, 31– 46.
Dai, A. and Wigley, T.M.L. (2000) Global patterns of ENSO-induced precipitation. Geophysical Research Letters, 27, 1283– 1286.
Dätwyler, C., Grosjean, M., Steiger, N.J. and Neukom, R. (2020) Teleconnections and relationship between the El Niño–Southern Oscillation (ENSO) and the southern annular mode (SAM) in reconstructions and models over the past millennium. Climate of the Past, 16, 743– 756.
Dee, D. P., et al. (2011). "The ERA‐Interim reanalysis: Configuration and performance of the data assimilation system." Quarterly Journal of the Royal Meteorological Society 137(656): 553-597.
Deser, C. and Wallace, J.M. (1987) El Niño events and their relation to the Southern Oscillation: 1925–1986. Journal of Geophysical Research: Oceans, 92, 14189– 14196.
DiNezio, P. N. and C. Deser (2014). "Nonlinear Controls on the Persistence of La Niña*." Journal of Climate 27(19): 7335-7355.
Douglas Schuster, N. (2010). Content, discovery, and accessibility enhancements to the NCAR Research Data Archive. 26th Conference on Interactive Information and Processing Systems.
Enfield, D.B. (1989) El Niño, past and present. Reviews of Geophysics, 27, 159– 187.
Enfield, D.B. and Cid, S.L. (1991) Low-frequency changes in El Niño–Southern Oscillation. Journal of Climate, 4, 1137– 1146.
Folland, C.K., Parker, D.E. and Kates, F.E. (1984) Worldwide marine temperature fluctuations 1856–1981. Nature, 310, 670– 673.
Folland, C. K. and D. E. Parker (1995). "Correction of instrumental biases in historical sea surface temperature data." Quarterly Journal of the Royal Meteorological Society 121(522): 319-367.
Fredriksen, H.-B., Berner, J., Subramanian, A.C. and Capotondi, A. (2020) How does El Niño–Southern Oscillation change under global warming—a first look at CMIP6. Geophysical Research Letters, 47, e2020GL090640.
Freeman, E., et al. (2017). "ICOADS Release 3.0: a major update to the historical marine climate record." International Journal of Climatology 37(5): 2211-2232.
Freund, M.B., Henley, B.J., Karoly, D.J., McGregor, H.V., Abram, N.J. and Dommenget, D. (2019) Higher frequency of central Pacific El Niño events in recent decades relative to past centuries. Nature Geoscience, 12, 450– 455.
Garcia-Herrera, R., et al. (2008). "A Chronology of El Niño Events from Primary Documentary Sources in Northern Peru*." Journal of Climate 21(9): 1948-1962.
Garfinkel, C. I., et al. (2019). "The salience of nonlinearities in the boreal winter response to ENSO: North Pacific and North America." Climate Dynamics 52(7): 4429-4446.
Gelaro, R., et al. (2017). "The Modern-Era Retrospective Analysis for Research and Applications, Version 2 (MERRA-2)." Journal of Climate 30(14): 5419-5454.
Gergis, J.L. and Fowler, A.M. (2005) Classification of synchronous oceanic and atmospheric El Niño–Southern Oscillation (ENSO) events for palaeoclimate reconstruction. International Journal of Climatology, 25, 1541– 1565.
Gergis, J.L. and Fowler, A.M. (2009) A history of ENSO events since A.D. 1525: implications for future climate change. Climatic Change, 92, 343– 387.
Giese, B.S., Compo, G.P., Slowey, N.C., Sardeshmukh, P.D., Carton, J.A., Ray, S. and Whitaker, J.S.(2010) The 1918/19 El Niño. Bulletin of the American Meteorological Society, 91, 177– 183.
Giese, B.S. and Ray, S. (2011) El Niño variability in simple ocean data assimilation (SODA), 1871–2008. Journal of Geophysical Research: Oceans, 116, C02024.
Giese, B.S., Seidel, H.F., Compo, G.P. and Sardeshmukh, P.D. (2016) An ensemble of ocean reanalyses for 1815–2013 with sparse observational input. Journal of Geophysical Research: Oceans, 121, 6891– 6910.
Glantz, M. H. and I. J. Ramirez (2020). "Reviewing the Oceanic Niño Index (ONI) to enhance societal readiness for El Niño’s impacts." International Journal of Disaster Risk Science 11(3): 394-403.
Global Climate Observing System (GCOS) Working Group on Surface Pressure (WG-SP). (2018). www.esrl.noaa.gov/psd/gcos_wgsp/
Goddard, L. and M. Dilley (2005). "El Niño: catastrophe or opportunity." Journal of Climate 18(5): 651-665.
Guilyardi, E. (2006). "El Niño–mean state–seasonal cycle interactions in a multi-model ensemble." Climate Dynamics 26(4): 329-348.
Hakim, G.J., Emile-Geay, J., Steig, E.J., Noone, D., Anderson, D.M., Tardif, R., Steiger, N. and Perkins, W.A. (2016) The last millennium climate reanalysis project: framework and first results. Journal of Geophysical Research: Atmospheres, 121, 6745– 6764.
Ham, Y.-G. and J.-S. Kug (2012). "How well do current climate models simulate two types of El Niño?" Climate Dynamics 39(1): 383-398.
Hameed, S. N., et al. (2018). "A model for super El Niños." Nature Communications 9(1): 2528.
Hanley, D.E., Bourassa, M.A., O'Brien, J.J., Smith, S.R. and Spade, E.R. (2003) A quantitative evaluation of ENSO indices. Journal of Climate, 16, 1249– 1258.
Hausfather, Z., Cowtan, K., Clarke, D.C., Jacobs, P., Richardson, M. and Rohde, R. (2017) Assessing recent warming using instrumentally homogeneous sea surface temperature records. Science Advances, 3, e1601207.
Hayashi, M. and F. F. Jin (2017). "Subsurface nonlinear dynamical heating and ENSO asymmetry." Geophysical Research Letters 44(24): 12,427-412,435.
Hendon, H.H., Lim, E., Wang, G., Alves, O. and Hudson, D. (2009) Prospects for predicting two flavors of El Niño. Geophysical Research Letters, 36, L19713.
Hennermann, K. and Berrisford, P.: What are the changes from ERA-Interim to ERA5? (2018). https://confluence.ecmwf.int/pages/viewpage.action?pageId=74764925
Hersbach, H., et al. (2020) The ERA5 global reanalysis. Quarterly Journal of the Royal Meteorological Society, 146, 1999– 2049.
Hersbach, H., et al. (2015). "ERA-20CM: a twentieth-century atmospheric model ensemble." Quarterly Journal of the Royal Meteorological Society 141(691): 2350-2375.
Hirahara, S., et al. (2014). "Centennial-Scale Sea Surface Temperature Analysis and Its Uncertainty." Journal of Climate 27(1): 57-75.
Hong, L.-C. (2016). Super El Niño, Springer.
Hu, Z.-Z., et al. (2014). "Why were some La Niñas followed by another La Niña?" Climate Dynamics 42(3): 1029-1042.
Huang, B., et al. (2015). "Extended Reconstructed Sea Surface Temperature Version 4 (ERSST.v4). Part I: Upgrades and Intercomparisons." Journal of Climate 28(3): 911-930.
Huang, B., et al. (2016). "Further Exploring and Quantifying Uncertainties for Extended Reconstructed Sea Surface Temperature (ERSST) Version 4 (v4)." Journal of Climate 29(9): 3119-3142.
Huang, B., et al. (2016). "Ranking the strongest ENSO events while incorporating SST uncertainty." Geophysical Research Letters 43(17): 9165-9172.
Huang, B., et al. (2017). "Extended reconstructed sea surface temperature, version 5 (ERSSTv5): upgrades, validations, and intercomparisons." Journal of Climate 30(20): 8179-8205.
Huang, B., et al. (2020). "How Significant Was the 1877/78 El Niño?" Journal of Climate 33(11): 4853-4869.
Hurwitz, M., et al. (2011). "Response of the Antarctic stratosphere to two types of El Niño events." Journal of the Atmospheric Sciences 68(4): 812-822.
Ishii, M., et al. (2005). "Objective analyses of sea-surface temperature and marine meteorological variables for the 20th century using ICOADS and the Kobe Collection." International Journal of Climatology 25(7): 865-879.
Japan Meteorological Agency. "El Nino Monitoring and Outlook" ds.data.jma.go.jp/tcc/tcc/products/elnino/elmonout.html
Jiang, W., Huang, P., Huang, G. and Ying, J. (2021) Origins of the excessive westward extension of ENSO SST simulated in CMIP5 and CMIP6 models. Journal of Climate, 34, 2839– 2851.
Kalnay, E., et al. (1996) The NCEP/NCAR 40-year reanalysis project. Bulletin of the American Meteorological Society, 77, 437– 472.
Kanamitsu, M., et al. (2002). "Ncep–doe amip-ii reanalysis (r-2)." Bulletin of the American Meteorological Society 83(11): 1631-1644.
Kao, H.-Y. and Yu, J.-Y. (2009) Contrasting eastern-Pacific and central-Pacific types of ENSO. Journal of Climate, 22, 615– 632.
Kaplan, A., et al. (1998). "Analyses of global sea surface temperature 1856–1991." Journal of Geophysical Research: Oceans 103(C9): 18567-18589.
Karl, T.R., Arguez, A., Huang, B., Lawrimore, J.H., McMahon, J.R., Menne, M.J., Peterson, T.C., Vose, R.S. and Zhang, H.-M. (2015) Possible artifacts of data biases in the recent global surface warming hiatus. Science, 348, 1469– 1472.
Karnauskas, K. B., et al. (2012). "A Pacific Centennial Oscillation Predicted by Coupled GCMs*." Journal of Climate 25(17): 5943-5961.
Keeley, S. (2018). “ECMWF Climate Reanalysis” www.ecmwf.int/en/research/climate-reanalysis.
Kennedy, J. J., et al. (2011). "Reassessing biases and other uncertainties in sea surface temperature observations measured in situ since 1850: 1. Measurement and sampling uncertainties." Journal of Geophysical Research: Atmospheres 116(D14).
Kennedy, J. J. (2014). "A review of uncertainty in in situ measurements and data sets of sea surface temperature." Reviews of Geophysics 52(1): 1-32.
Kennedy, J. J., et al. (2019). "An ensemble data set of sea-surface temperature change from 1850: the Met Office Hadley Centre HadSST.4.0.0.0 data set." Journal of Geophysical Research: Atmospheres 0(ja).
Kent, E. C., et al. (2013). "Global analysis of night marine air temperature and its uncertainty since 1880: The HadNMAT2 data set." Journal of Geophysical Research: Atmospheres 118(3): 1281-1298.
Kent, E.C., et al. (2017) A call for new approaches to quantifying biases in observations of sea surface temperature. Bulletin of the American Meteorological Society, 98, 1601– 1616.
Kessler, W. S. (2002). "Is ENSO a cycle or a series of events?" Geophysical Research Letters 29(23): 40-41-40-44.
Khodri, M., et al. (2017). "Tropical explosive volcanic eruptions can trigger El Niño by cooling tropical Africa." Nature Communications 8(1): 1-13.
Kiladis, G. N. and H. F. Diaz (1986). "An Analysis of the 1877–78 ENSO Episode and Comparison with 1982–83." Monthly Weather Review 114(6): 1035-1047.
Ku, H. H. (1966). "Notes on the use of propagation of error formulas." Journal of Research of the National Bureau of Standards 70(4): 263-273.
Kug, J.-S., et al. (2009). "Two types of El Niño events: cold tongue El Niño and warm pool El Niño." Journal of Climate 22(6): 1499-1515.
L'Heureux, M.L., et al. (2017) Observing and predicting the 2015/16 El Niño. Bulletin of the American Meteorological Society, 98, 1363– 1382.
Laloyaux, P., et al. (2018). "CERA-20C: A Coupled Reanalysis of the Twentieth Century." Journal of Advances in Modeling Earth Systems 10(5): 1172-1195.
Langton, S.J., et al. (2008) 3500 yr record of centennial-scale climate variability from the Western Pacific Warm Pool. Geology, 36, 795– 798.
Latif, M., et al. (2015). "Super El Niños in response to global warming in a climate model." Climatic Change 132(4): 489-500.
Lemmon, D. E. and K. B. Karnauskas (2019). "A metric for quantifying El Niño pattern diversity with implications for ENSO–mean state interaction." Climate Dynamics 52(12): 7511-7523.
Levine, A.F.Z. and McPhaden, M.J. (2016) How the July 2014 easterly wind burst gave the 2015–2016 El Niño a head start. Geophysical Research Letters, 43, 6503– 6510.
Lewis, S.C. and LeGrande, A.N. (2015) Stability of ENSO and its tropical Pacific teleconnections over the Last Millennium. Climate of the Past, 11, 1347– 1360.
Li, J., et al. (2011) Interdecadal modulation of El Niño amplitude during the past millennium. Nature Climate Change, 1, 114– 118.
Lin, K. H. E., et al. (2020). "Historical droughts in the Qing dynasty (1644–1911) of China." Clim. Past 16(3): 911-931.
Liu, W., et al. (2015). "Extended Reconstructed Sea Surface Temperature Version 4 (ERSST.v4): Part II. Parametric and Structural Uncertainty Estimations." Journal of Climate 28(3): 931-951.
Liu, Y., et al. (2017) Recent enhancement of central Pacific El Niño variability relative to last eight centuries. Nature Communications, 8, 15386.
Luan, Y., et al. (2012) Early and mid-Holocene climate in the tropical Pacific: seasonal cycle and interannual variability induced by insolation changes. Climate of the Past, 8, 1093– 1108.
Lucena, D.B., et al. (2011) Rainfall response in Northeast Brazil from ocean climate variability during the second half of the twentieth century. Journal of Climate, 24, 6174– 6184.
McGregor, S., et al. (2013) Inferred changes in El Niño–Southern Oscillation variance over the past six centuries. Climate of the Past, 9, 2269– 2284.
McGregor, S., et al. (2010) A unified proxy for ENSO and PDO variability since 1650. Climate of the Past, 6, 1– 17.
McPhaden, M.J. (1999) Genesis and evolution of the 1997–98 El Niño. Science, 283, 950– 954.
McPhaden, M.J., et al. (2020) El Niño Southern Oscillation in a Changing Climate. Hoboken, NJ: John Wiley & Sons.
McPhaden, M.J., et al. (2015) The curious case of the EL Niño that never happened: a perspective from 40 years of progress in climate research and forecasting. Bulletin of the American Meteorological Society, 96, 1647– 1665.
Meehl, G.A., et al. (2006) Future changes of El Niño in two global coupled climate models. Climate Dynamics, 26, 549– 566.
Morice, C.P., et al. (2021) An updated assessment of near-surface temperature change from 1850: the HadCRUT5 data set. Journal of Geophysical Research: Atmospheres, 126, e2019JD032361.
NASA. (2018). “NASA Earth Observations” neo.sci.gsfc.nasa.gov/view.php?datasetId=MYD28M.
Neelin, J.D., et al (1998) ENSO theory. Journal of Geophysical Research: Oceans, 103, 14261– 14290.
Nguyen, P. L., et al. (2021). "Combined impacts of the El Niño‐Southern Oscillation and Pacific decadal oscillation on global droughts assessed using the standardized precipitation evapotranspiration index." International Journal of Climatology 41: E1645-E1662.
Null, J. (2018) “El Nino and La Nina Years and Intensities”. ggweather.com/enso/oni.htm
NOAA’s Climate Prediction Center. “Cold and Warm Episodes by Season”. origin.cpc.ncep.noaa.gov/products/analysis_monitoring/ensostuff/ONI_v5.php
NOAA’s Earth System Research Laboratory. (2020). https://esrl.noaa.gov/gmd/
NOAA’s National Centers for Environmental Information. (2018). “Equatorial Pacific Sea Surface Temperatures” www.ncdc.noaa.gov/teleconnections/enso/indicators/sst/
O'Carroll, A.G., et al. (2019) Observational needs of sea surface temperature. Frontiers in Marine Science, 6, 420.
Ohba, M. and Ueda, H. (2009) Role of nonlinear atmospheric response to SST on the asymmetric transition process of ENSO. Journal of Climate, 22, 177– 192.
Ohba, M. and Watanabe, M. (2012) Role of the Indo-Pacific Interbasin coupling in predicting asymmetric ENSO transition and duration. Journal of Climate, 25, 3321– 3335.
Okumura, Y.M. and Deser, C. (2010) Asymmetry in the duration of El Niño and La Niña. Journal of Climate, 23, 5826– 5843.
Okumura, Y. M., et al. (2011). "A proposed mechanism for the asymmetric duration of El Niño and La Niña." Journal of Climate 24(15): 3822-3829.
Ortlieb, L. (2000). The Documented Historical Record of El Nino Events in Peru: An Update of the Quinn Record (Sixteenth through Nineteenth Centuries): 207-295.
Parker, W. S. (2016). "Reanalyses and Observations: What’s the Difference?" Bulletin of the American Meteorological Society 97(9): 1565-1572.
Parkinson, C.L. (2003) Aqua: an earth-observing satellite mission to examine water and other climate variables. IEEE Transactions on Geoscience and Remote Sensing, 41, 173– 183.
Philander, S. (1990) El Niño, La Niña, and the Southern Oscillation. S. George Philander. Academic press, San Diego, CA, 1989. x, 293 pp., illus. $59.50. International geophysics series, vol. 46. Science, 248, 904– 905.
Phillips, J., Rajagopalan, B., Cane, M. and Rosenzweig, C. (1999) The role of ENSO in determining climate and maize yield variability in the U.S. cornbelt. International Journal of Climatology, 19, 877– 888.
Pillar, H.R., Johnson, H.L., Marshall, D.P., Heimbach, P. and Takao, S. (2018) Impacts of atmospheric reanalysis uncertainty on Atlantic overturning estimates at 25°N. Journal of Climate, 31, 8719– 8744.
Poli, P., et al. (2016). "ERA-20C: An Atmospheric Reanalysis of the Twentieth Century." Journal of Climate 29(11): 4083-4097.
Predybaylo, E., et al. (2017) Impacts of a Pinatubo-size volcanic eruption on ENSO. Journal of Geophysical Research: Atmospheres, 122, 925– 947.
Qian, C., et al. (2011) On changing El Niño: a view from time-varying annual cycle, interannual variability, and mean state. Journal of Climate, 24, 6486– 6500.
Quinn, W.H. (1993) The large-scale ENSO event, the El Niño and other important regional features. Bulletin de l'Institut Français d'Etudes Andines, 22, 13– 34.
Quinn, W. H., et al. (1987). "El Niño occurrences over the past four and a half centuries." Journal of Geophysical Research: Oceans 92(C13): 14449-14461.
Quinn, W.H., et al. (1978) Historical trends and statistics of the Southern Oscillation, El Niño, and Indonesian droughts. Fishery Bulletin, 76, 663– 678.
Ramesh, N. and Murtugudde, R. (2013) All flavours of El Niño have similar early subsurface origins. Nature Climate Change, 3, 42– 46.
Ray, S. and Giese, B.S. (2012) Historical changes in El Niño and La Niña characteristics in an ocean reanalysis. Journal of Geophysical Research, 117, C11007.
Rayner, N. A., et al. (2006). "Improved analyses of changes and uncertainties in sea surface temperature measured in situ since the mid-nineteenth century: The HadSST2 dataset." Journal of Climate 19(3): 446-469.
Rayner, N.A., et al. (2003) Global analyses of sea surface temperature, sea ice, and night marine air temperature since the late nineteenth century. Journal of Geophysical Research: Atmospheres, 108, 4407.
Ren, H. L. and F. F. Jin (2011). "Niño indices for two types of ENSO." Geophysical Research Letters 38(4).
Reynolds, R. W. (1988). "A Real-Time Global Sea Surface Temperature Analysis." Journal of Climate 1(1): 75-87.
Reynolds, R. W. and T. M. Smith (1994). "Improved Global Sea Surface Temperature Analyses Using Optimum Interpolation." Journal of Climate 7(6): 929-948.
Reynolds, R. W., et al. (2002). "An Improved In Situ and Satellite SST Analysis for Climate." Journal of Climate 15(13): 1609-1625.
Rienecker, M.M., et al. (2011) MERRA: NASA's modern-era retrospective analysis for research and applications. Journal of Climate, 24, 3624– 3648.
Rimbu, N., et al. (2004). "Impacts of the North Atlantic Oscillation and the El Nino–Southern Oscillation on Danube river flow variability." Geophysical Research Letters 31(23).
Ropelewski, C.F. and Jones, P.D. (1987) An extension of the Tahiti–Darwin southern oscillation index. Monthly Weather Review, 115, 2161– 2165.
Roundy, P. E., et al. (2010). "Modulation of the global atmospheric circulation by combined activity in the Madden–Julian oscillation and the El Niño–Southern Oscillation during boreal winter." Journal of Climate 23(15): 4045-4059.
Saha, S., et al. (2010). "The NCEP climate forecast system reanalysis." Bulletin of the American Meteorological Society 91(8): 1015-1058.
Sanabria, Janeet Margarita. "Interannual variability of the rainfall regime and strong ENSO events along the Peruvian Pacific Basin: large-scale control mechanisms. Meteorology". Université Paul Sabatier - Toulouse III, 2018. English. NNT : 2018TOU30143 . tel-02301101
Sanchez, S.C., et al. (2020) A continuous record of central tropical Pacific climate since the midnineteenth century reconstructed from fanning and Palmyra Island corals: a case study in coral data reanalysis. Paleoceanography and Paleoclimatology, 35, e2020PA003848.
Santoso, A., et al. (2017) The defining characteristics of ENSO extremes and the strong 2015/2016 El Niño. Reviews of Geophysics, 55, 1079– 1129.
Sardeshmukh, P. D., et al. (2000). "Changes of probability associated with El Niño." Journal of Climate 13(24): 4268-4286.
Shrestha, A. and R. Kostaschuk (2005). "El Nino/Southern Oscillation (ENSO)-related variablity in mean-monthly streamflow in Nepal." Journal of Hydrology 308(1-4): 33-49.
Shukla, R. P., et al. (2011). "Prediction of Indian summer monsoon rainfall using Niño indices: a neural network approach." Atmospheric Research 102(1-2): 99-109.
Singh, D., et al. (2018) Climate and the global famine of 1876–78. Journal of Climate, 31, 9445– 9467.
Slingo, J.M. and Annamalai, H. (2000) 1997: the El Niño of the century and the response of the Indian summer monsoon. Monthly Weather Review, 128, 1778– 1797.
Slivinski, L. C., et al. (2019). "Towards a more reliable historical reanalysis: Improvements for version 3 of the Twentieth Century Reanalysis system." Quarterly Journal of the Royal Meteorological Society 145(724): 2876-2908.
Smith, C. A. and P. D. Sardeshmukh (2000). "The effect of ENSO on the intraseasonal variance of surface temperatures in winter." International Journal of Climatology 20(13): 1543-1557.
Smith, T. M., et al. (2008). "Improvements to NOAA’s historical merged land–ocean surface temperature analysis (1880–2006)." Journal of Climate 21(10): 2283-2296.
Song, et al. (2016) A classified El Niño index using AVHRR remote-sensing SST data. International Journal of Remote Sensing, 37, 403– 417.
Stahle, D.W., et al. (1998) Experimental dendroclimatic reconstruction of the Southern Oscillation. Bulletin of the American Meteorological Society, 79, 2137– 2152.
Sullivan, A., et al. (2016) Robust contribution of decadal anomalies to the frequency of central-Pacific El Niño. Scientific Reports, 6, 38540.
Takahashi, K., et al. (2014) El índice costero El Niño (ICEN): historia y actualización. Boletin Tecnico, 1, 8– 9.
Tardif, R., et al. (2019) Last Millennium Reanalysis with an expanded proxy database and seasonal proxy modeling. Climate of the Past, 15, 1251– 1273.
Thompson, D.W.J., et al. (2008) A large discontinuity in the mid-twentieth century in observed global-mean surface temperature. Nature, 453, 646– 649.
Thorne, P.W., et al. (2005) Uncertainties in climate trends: lessons from upper-air temperature records. Bulletin of the American Meteorological Society, 86, 1437– 1442.
Tian, Z., et al. (2017) Causes of ENSO weakening during the mid-Holocene. Journal of Climate, 30, 7049– 7070.
Tindall, J.C., et al. (2016) Accounting for centennial-scale variability when detecting changes in ENSO: a study of the Pliocene. Paleoceanography, 31, 1330– 1349.
Titchner, H. A. and N. A. Rayner (2014). "The Met Office Hadley Centre sea ice and sea surface temperature data set, version 2: 1. Sea ice concentrations." Journal of Geophysical Research: Atmospheres 119(6): 2864-2889.
Trenberth, K.E. (1997) The definition of El Niño. Bulletin of the American Meteorological Society, 78, 2771– 2778.
Trenberth, K. E. and T. J. Hoar (1997). "El Niño and climate change." Geophysical Research Letters 24(23): 3057-3060.
Trouet, V. and G. J. Van Oldenborgh (2013). "KNMI Climate Explorer: a web-based research tool for high-resolution paleoclimatology." Tree-Ring Research 69(1): 3-13.
Troup, A.J. (1965) The “southern oscillation”. Quarterly Journal of the Royal Meteorological Society, 91, 490– 506.
Tsonis, A. A. and K. L. Swanson (2008). "Topology and predictability of El Nino and La Nina networks." Physical Review Letters 100(22): 228502.
Turkington, T., et al. (2019) The impact of global warming on sea surface temperature based El Niño–Southern Oscillation monitoring indices. International Journal of Climatology, 39, 1092– 1103.
Ummenhofer, C.C., et al. (2011) Multi-decadal modulation of the El Niño–Indian monsoon relationship by Indian Ocean variability. Environmental Research Letters, 6, 034006.
van der Werf, G.R., et al. (2004) Continental-scale partitioning of fire emissions during the 1997–2001 El Niño/La Niña period. Science, 303, 73– 76.
van Oldenborgh, G.J., et al. (2021) Defining El Niño indices in a warming climate. Environmental Research Letters, 16, 044003.
van Oldenborgh, G., KNMI Climate Explorer. Retrieved from: https://climexp.knmi.nl/about.cgi?id=someone@somewhere
Voskresenskaya, E.N. and Marchukova, O.V. (2017) Spatial classification of La Niña events. Izvestiya, Atmospheric and Oceanic Physics, 53, 111– 119.
Wallace, J.M. and Gutzler, D.S. (1981) Teleconnections in the geopotential height field during the Northern Hemisphere winter. Monthly Weather Review, 109, 784– 812.
Wang, B., et al. (2019) Historical change of El Niño properties sheds light on future changes of extreme El Niño. Proceedings of the National Academy of Sciences of the United States of America, 116, 22512– 22517.
Wang, Y., et al. (2001). "Impact of the preceding El Niño on the East Asian summer atmosphere circulation." Journal of the Meteorological Society of Japan. Ser. II 79(1B): 575-588.
Wang, B., et al. (2000) Pacific–East Asian teleconnection: How does ENSO affect East Asian climate? Journal of Climate, 13, 1517– 1536.
Wang, Z., et al. (2021) Evaluation of the performance of CMIP5 and CMIP6 models in simulating the South Pacific quadrupole–ENSO relationship. Atmospheric and Oceanic Science Letters, 14, 100057.
Webb, E. J. (2017). “A Reanalysis of the Extended Multivariate ENSO Index (MEI.ext) and Comparison of the 1877-78 and 2015-16 El Nino Events". 97th Annual AMS Conference.
ams.confex.com/ams/97Annual/webprogram/Paper317006.html
Webb, E. J. (2020). “Reanalysis of the Extended Multivariate ENSO Index”. 100th Annual AMS Conference
ams.confex.com/ams/2020Annual/webprogram/Paper369557.html
Webb, E. J. and B. I. Magi "The Ensemble Oceanic Niño Index." International Journal of Climatology n/a(n/a) (pages still being enumerated).
Wilson, R., et al. (2010) Reconstructing ENSO: the influence of method, proxy data, climate forcing and teleconnections. Journal of Quaternary Science, 25, 62– 78.
Wittenberg, A.T. (2009) Are historical records sufficient to constrain ENSO simulations? Geophysical Research Letters, 36, L12702.
Wolde-Georgis, T. (1997) El Niño and drought early warning in Ethiopia. Internet Journal of African Studies, 1997, 2.
Wolter, K. and M. S. Timlin (1993). Monitoring ENSO in COADS with a seasonally adjusted principal component index.
Wolter, K. and M. S. Timlin (1998). "Measuring the strength of ENSO events: How does 1997/98 rank?" Weather 53(9): 315-324.
Wolter, K. and M. S. Timlin (2011). "El Niño/Southern Oscillation behaviour since 1871 as diagnosed in an extended multivariate ENSO index (MEI.ext)." International Journal of Climatology 31(7): 1074-1087.
Woodruff, S.D., et al. (2011) ICOADS release 2.5: extensions and enhancements to the surface marine meteorological archive. International Journal of Climatology, 31, 951– 967.
Wu, X., et al. (2019). "What Controls the Duration of El Niño and La Niña Events?" Journal of Climate 32(18): 5941-5965.
Xie, S.-P., et al. (2009) Indian Ocean capacitor effect on Indo–Western Pacific climate during the summer following El Niño. Journal of Climate, 22, 730– 747.
Xie, R. and F.-F. Jin (2018). "Two leading ENSO modes and El Niño types in the Zebiak–Cane model." Journal of Climate 31(5): 1943-1962.
Yeh, S.-W., et al. (2012) Changes in the tropical Pacific SST trend from CMIP3 to CMIP5 and its implication of ENSO. Journal of Climate, 25, 7764– 7771.
Yeh, S.-W., et al. (2009) El Niño in a changing climate. Nature, 461, 511– 514.
Yu, J.-Y., et al. (2011) Subsurface ocean temperature indices for central-Pacific and eastern-Pacific types of El Niño and La Niña events. Theoretical and Applied Climatology, 103, 337– 344.
Yu, L., et al. (2008). 2008: Multidecade global flux datasets from the Objectively Analyzed Air-Sea Fluxes (OAFlux) Project: Latent and sensible heat fluxes, ocean evaporation, and related surface meteorological variables. Woods Hole Oceanographic Institution OAFlux Project Tec. Rep, Citeseer.
Yuan, Y. and S. Yang (2012). "Impacts of different types of El Niño on the East Asian climate: Focus on ENSO cycles." Journal of Climate 25(21): 7702-7722.
Zanchettin, D., et al. (2008) On ENSO impacts on European wintertime rainfalls and their modulation by the NAO and the Pacific multi-decadal variability described through the PDO index. International Journal of Climatology, 28, 995– 1006.
Zhang, W., et al. (2015) Impact of different El Niño types on the El Niño/IOD relationship. Geophysical Research Letters, 42, 8570– 8576.
Zhu, J., et al. (2012) Ensemble ENSO hindcasts initialized from multiple ocean analyses. Geophysical Research Letters, 39, L09602.
Zhu, J., et al. (2018). "Response of tropical terrestrial gross primary production to the super El Niño event in 2015." Journal of Geophysical Research: Biogeosciences 123(10): 3193-3203.
Zuo, H., et al. (2019). "The ECMWF operational ensemble reanalysis–analysis system for ocean and sea ice: a description of the system and assessment." Ocean Sci. 15(3): 779-808.